Free Access
Fig. 2
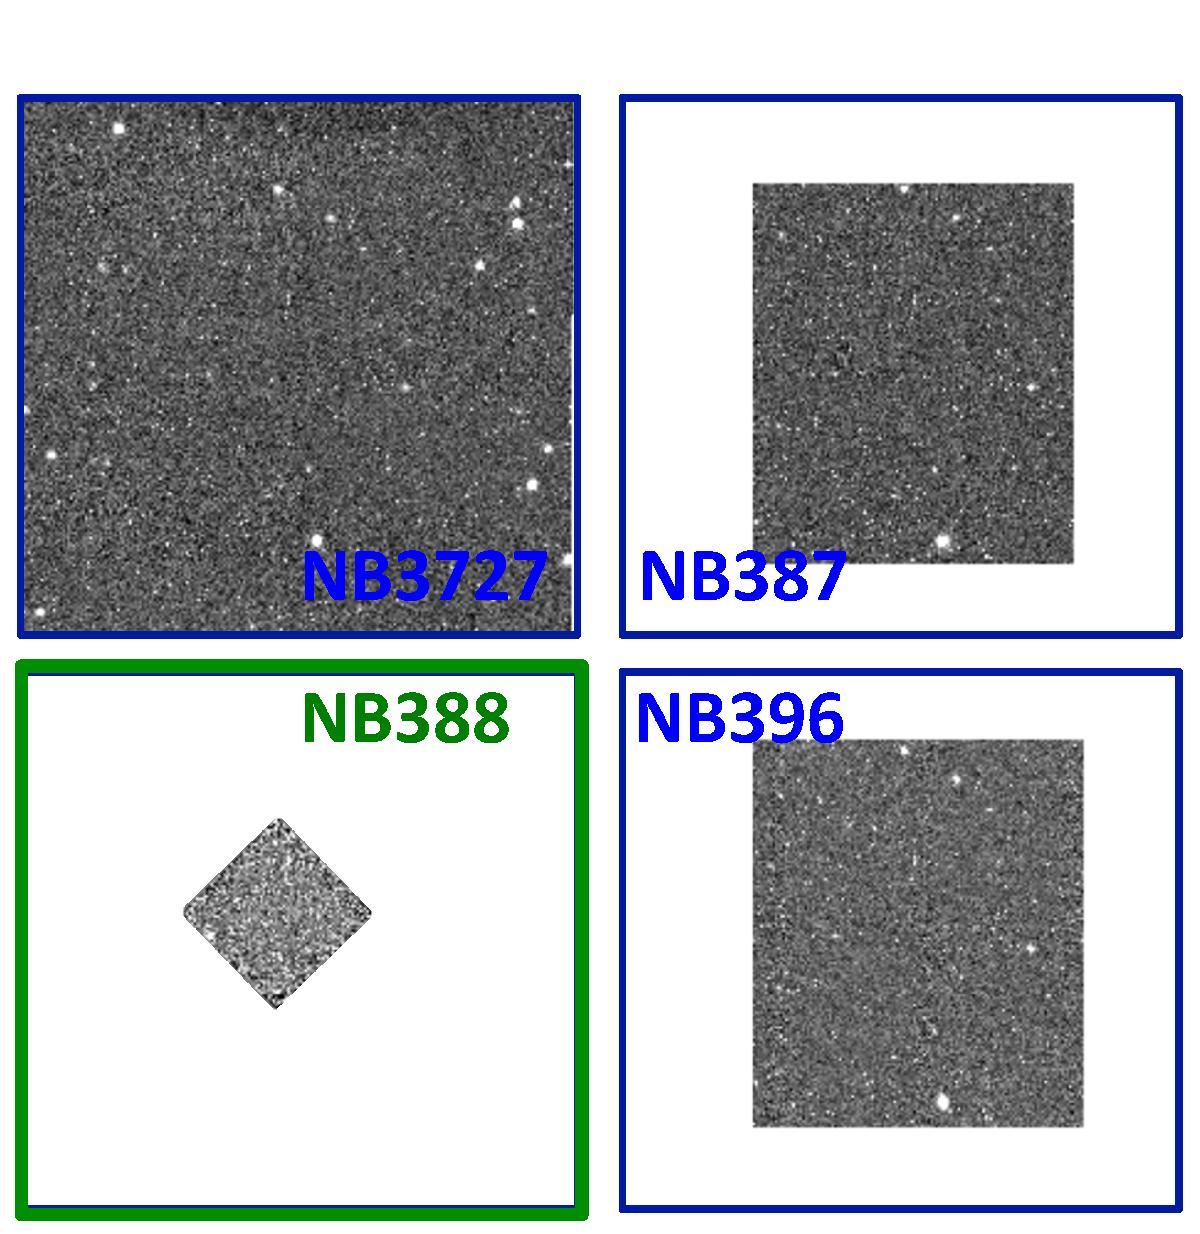
Area in E-CDFS covered by the four narrow-band images. The image obtained with NB3727 covers the entire E-CDFS area of 30′ × 30′, the other images a part of it. The blue and green squares indicate the area of E-CDFS and are coloured as the transmission curves in Fig. 1.
Current usage metrics show cumulative count of Article Views (full-text article views including HTML views, PDF and ePub downloads, according to the available data) and Abstracts Views on Vision4Press platform.
Data correspond to usage on the plateform after 2015. The current usage metrics is available 48-96 hours after online publication and is updated daily on week days.
Initial download of the metrics may take a while.