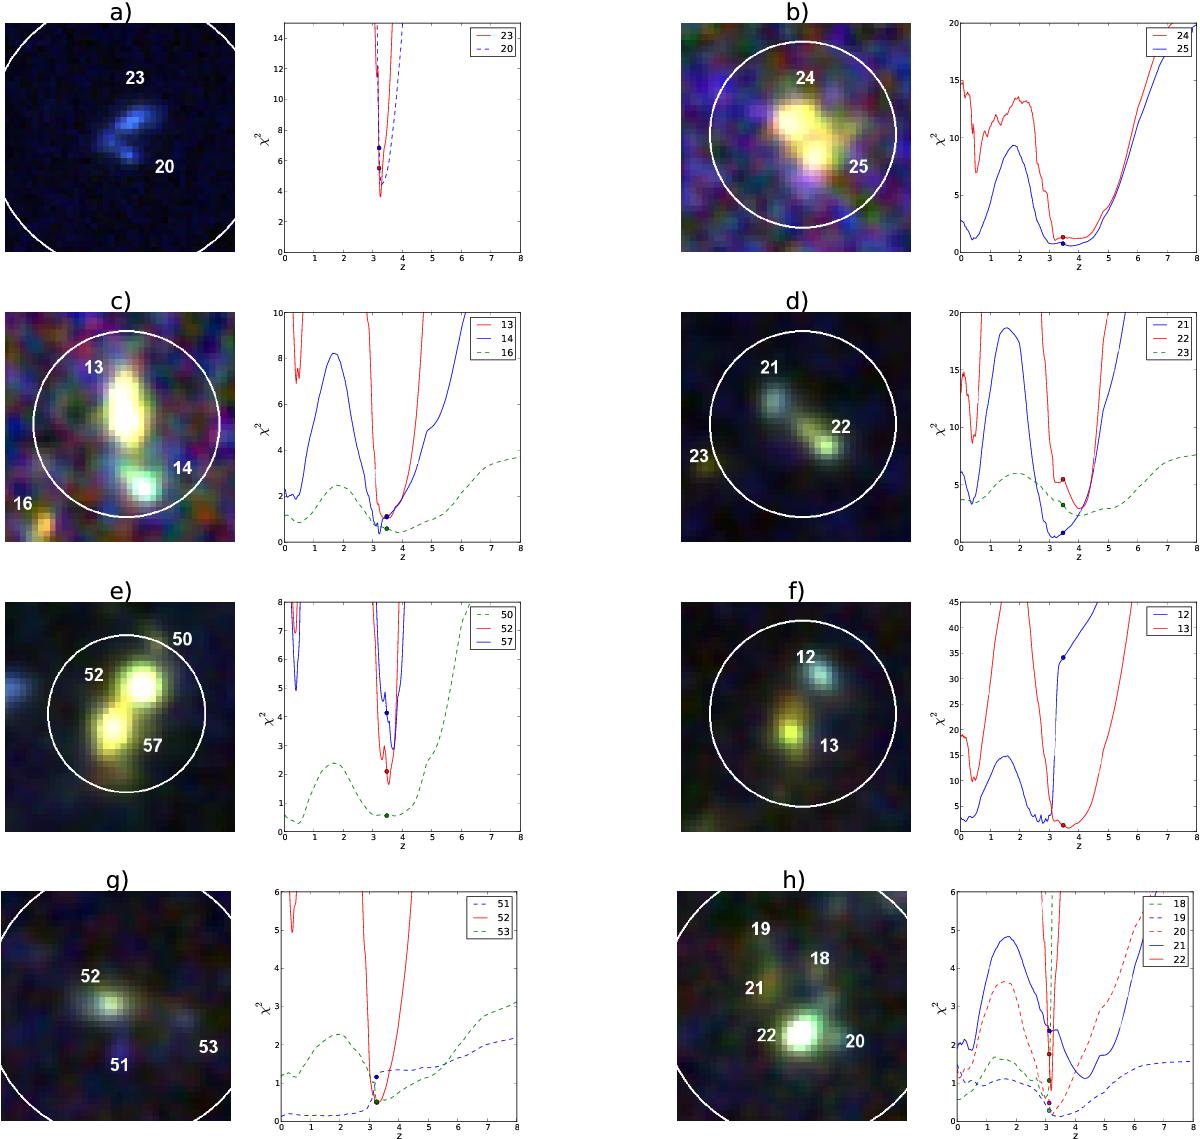
Fig. A.1

BVI colour images (left panels) and χ2 function versus photometric redshift (right panels). a) Object ID_CANDELS=6839 (z = 3.208): kept in the clean sample. It is composed of two clumps (numbers 23 and 20). The upper is brighter than the lower one. The white circle in the left panel has a radius equal to the PSF full width at half maximum of the ground-based narrow-band image, sampling the LyC at z = 3.208. The solid (dashed) line in the right panel corresponds to the brighter (fainter) clump, while the blue (red) dot indicates the χ2 of the SED fit derived by fixing the value of the redshift to the spectroscopic one. b) Object ID_CANDELS=4022 (z = 3.466): kept. The two solid lines in the right panel show that the two clumps (numbers 24 and 25) are equally bright. c) Object ID_CANDELS=3768 (z = 3.468): kept. The red and blue dots overlap. d) Object ID_CANDELS=3325 (z = 3.473): kept. e) Object ID_CANDELS=15 220 (z = 3.469): kept. The two solid lines in the right panel show that the two clumps are equally bright (numbers 52 and 57). f) Object ID_CANDELS=7645 (z = 3.478): removed. g) Object ID_CANDELS=17 905 (z = 3.242): removed. In the right panel, the red and green dots overlap. h) Object ID_CANDELS=23 527 (z = 3.116): removed. It is composed of five clumps. The two reddest ones have a broad χ2 function. The main component (number 22) is perfectly fitted at the spectroscopic redshift.
Current usage metrics show cumulative count of Article Views (full-text article views including HTML views, PDF and ePub downloads, according to the available data) and Abstracts Views on Vision4Press platform.
Data correspond to usage on the plateform after 2015. The current usage metrics is available 48-96 hours after online publication and is updated daily on week days.
Initial download of the metrics may take a while.


