Free Access
Fig. 5
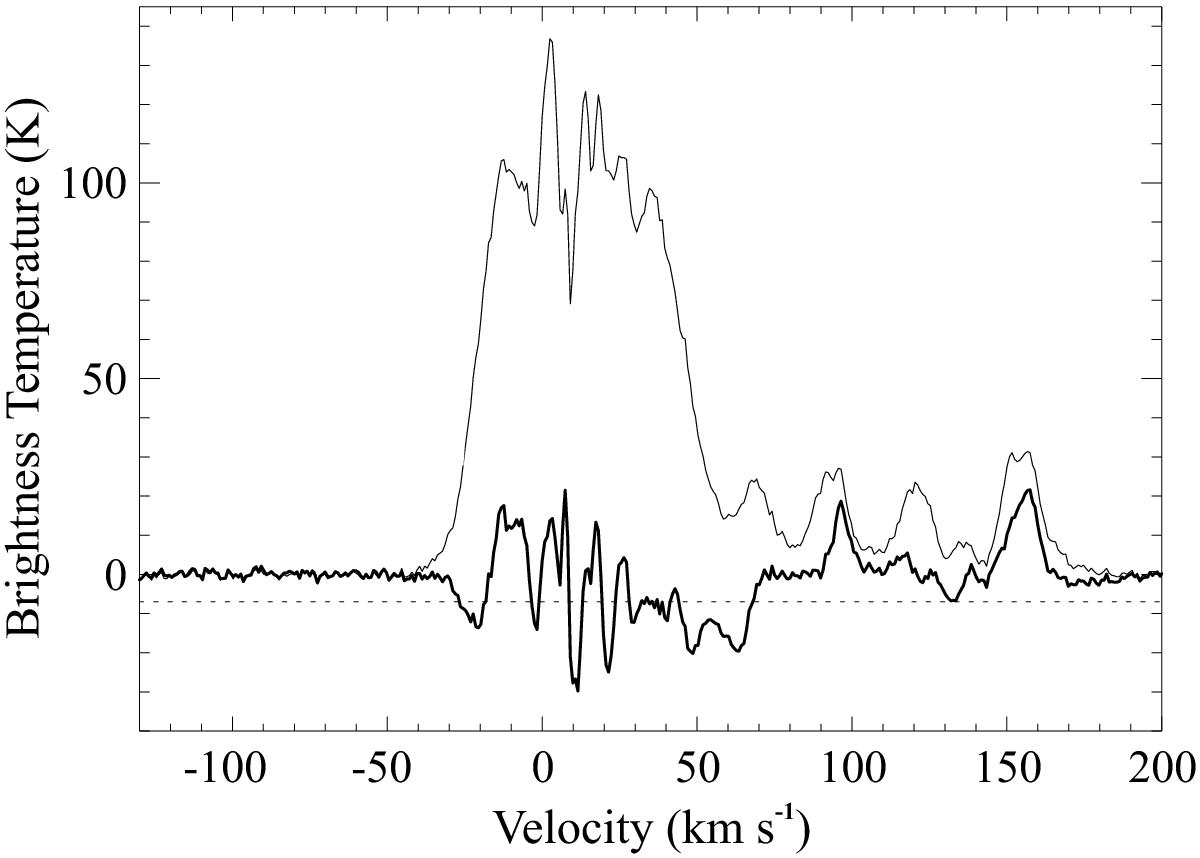
HI emission (thin line) and absorption (thick line) spectra towards SNR G11.0−0.0. The dashed line indicates absorption at the 5σ level, where σ is the noise level in the HI data cube.
Current usage metrics show cumulative count of Article Views (full-text article views including HTML views, PDF and ePub downloads, according to the available data) and Abstracts Views on Vision4Press platform.
Data correspond to usage on the plateform after 2015. The current usage metrics is available 48-96 hours after online publication and is updated daily on week days.
Initial download of the metrics may take a while.