Fig. 3
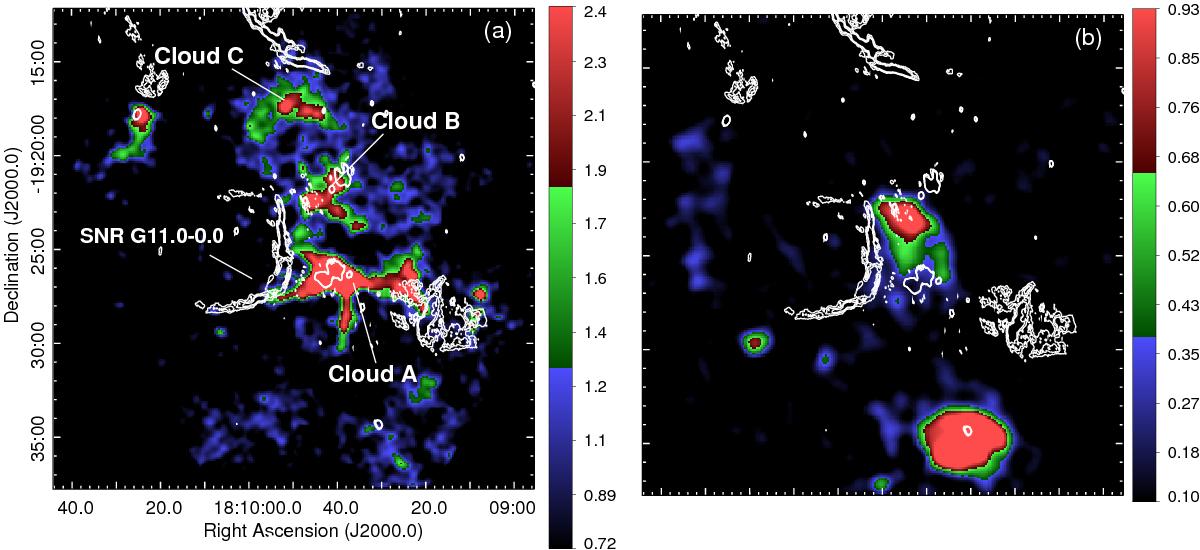
Distribution of the 12CO J = 3−2 gas in the field containing the SNR G11.0−0.0 and the TeV source HESS J1809−193. a) Averaged intensity distribution of the 12CO in the velocity range from 16 to 27 km s-1. b) Averaged intensity map of the molecular gas for velocities between 71 and 78 km s-1. In both panels the white contours delineate the radio continuum emission at 1.4 GHz. The wedge to the right of each panel shows the 12CO intensities in K km s-1.
Current usage metrics show cumulative count of Article Views (full-text article views including HTML views, PDF and ePub downloads, according to the available data) and Abstracts Views on Vision4Press platform.
Data correspond to usage on the plateform after 2015. The current usage metrics is available 48-96 hours after online publication and is updated daily on week days.
Initial download of the metrics may take a while.