Fig. 6
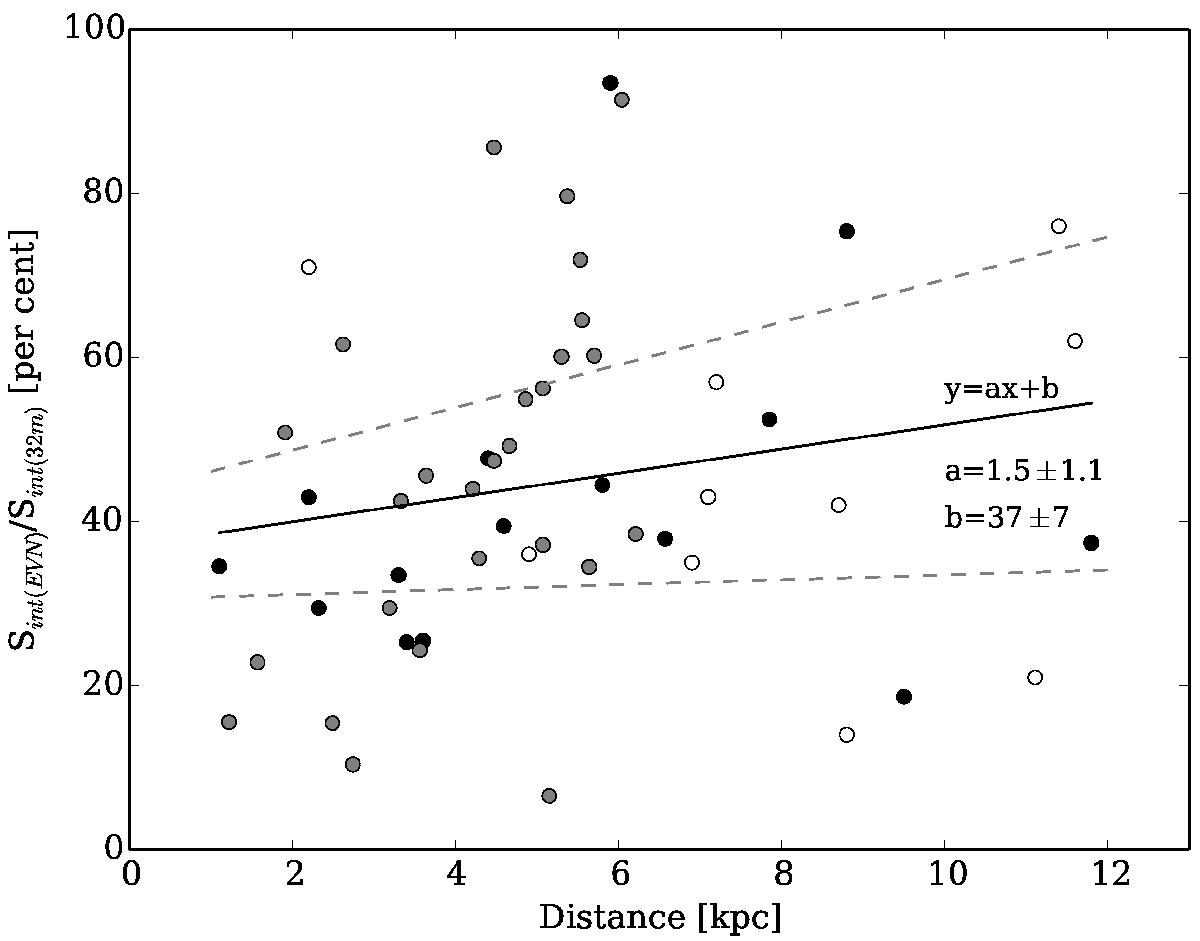
Ratios of integral fluxes (obtained using EVN and 32 m dish) vs. distances to targets. The black dots represent data from this work, while the grey and open circles to the data from Bartkiewicz et al. (2009, 2014), respectively. The least-square fit to all points is presented by the black line and the dashed grey lines limit the region due to the uncertainties of the fit.
Current usage metrics show cumulative count of Article Views (full-text article views including HTML views, PDF and ePub downloads, according to the available data) and Abstracts Views on Vision4Press platform.
Data correspond to usage on the plateform after 2015. The current usage metrics is available 48-96 hours after online publication and is updated daily on week days.
Initial download of the metrics may take a while.