Fig. 3
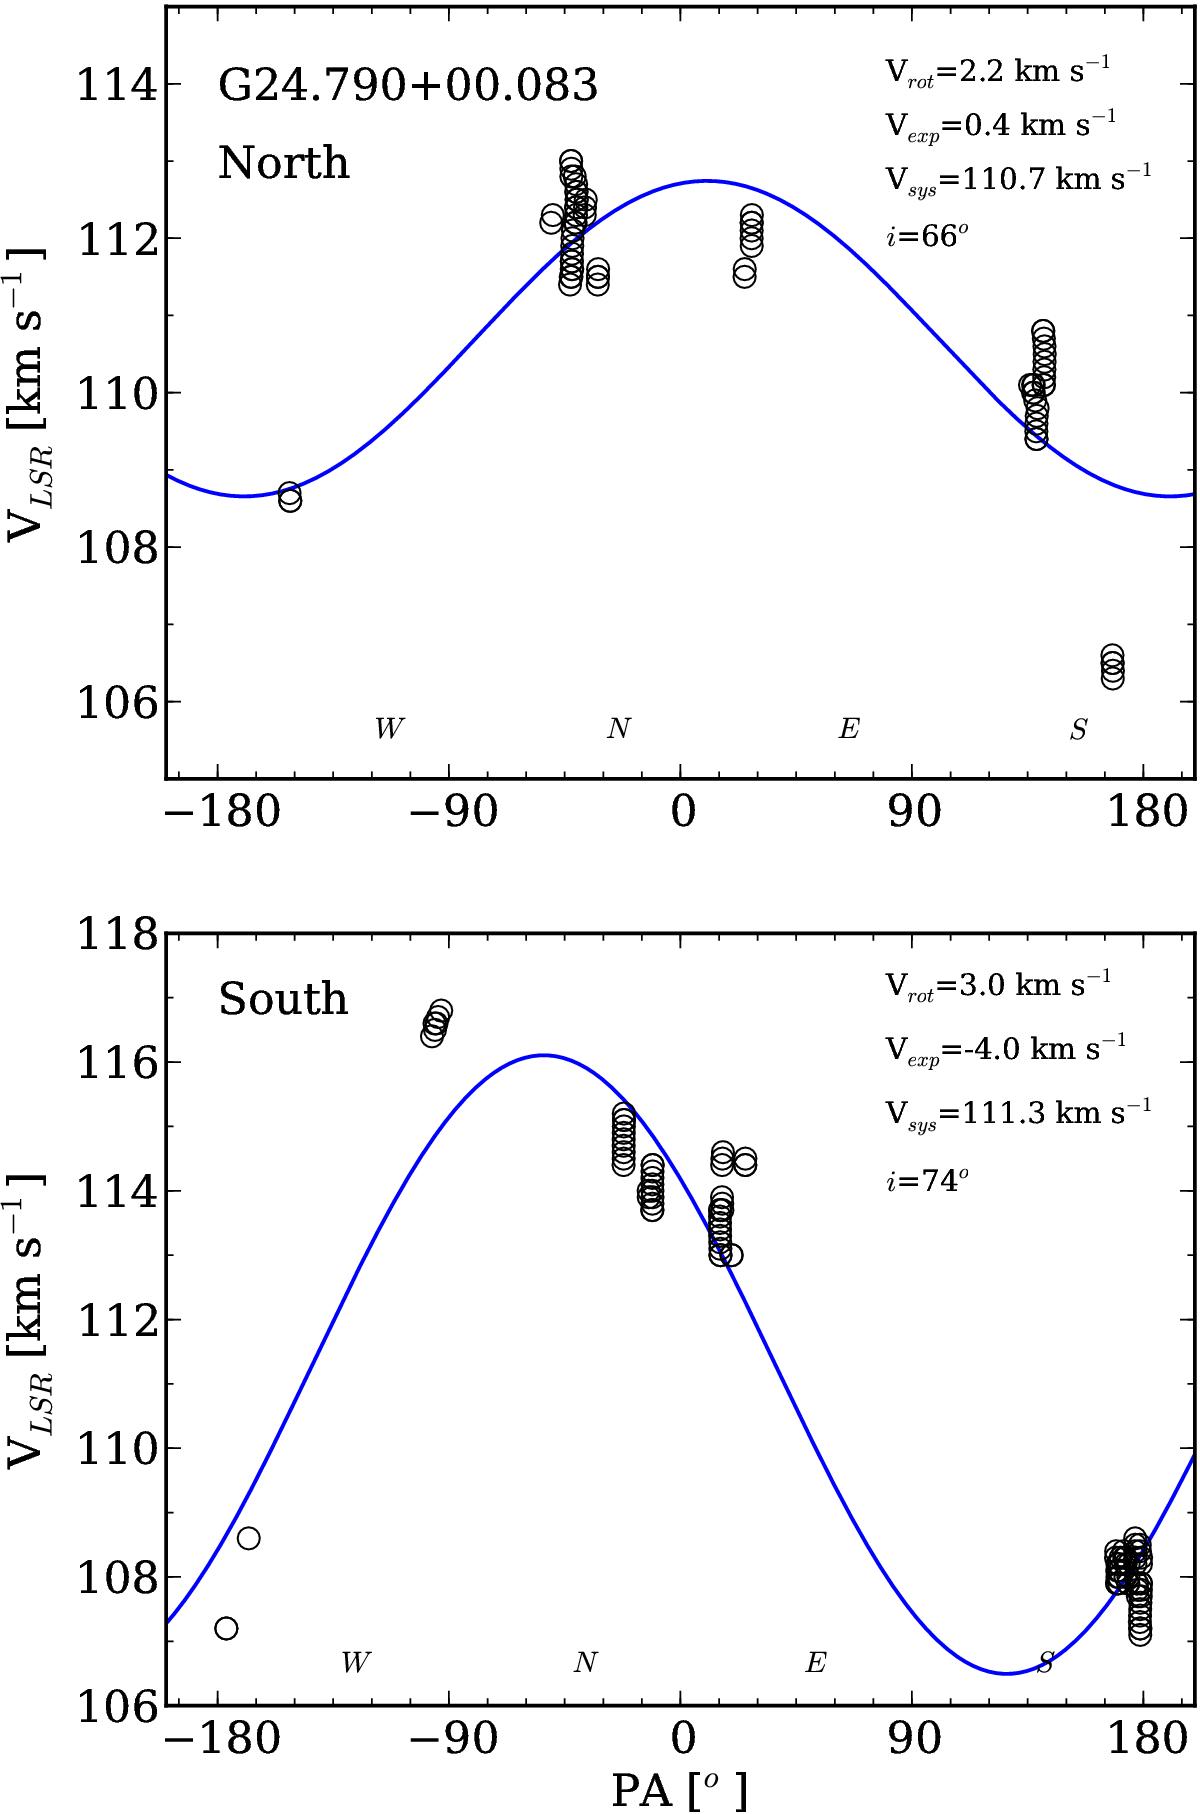
Velocity of the maser spots in G24.790+00.083 north (top) and south (bottom) versus azimuth angle measured from the major axis (north to east). Circles represent the data, while the lines represent the best kinematical models of rotating and expanding disks with infintesimal thickness, as described in Sect. 4.3. The main parameters of the fit are listed in the figures. The N, E, S, and W directions are also indicated for clarity.
Current usage metrics show cumulative count of Article Views (full-text article views including HTML views, PDF and ePub downloads, according to the available data) and Abstracts Views on Vision4Press platform.
Data correspond to usage on the plateform after 2015. The current usage metrics is available 48-96 hours after online publication and is updated daily on week days.
Initial download of the metrics may take a while.