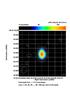
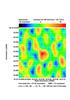
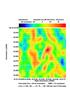
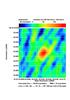
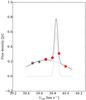
Fig. A.3
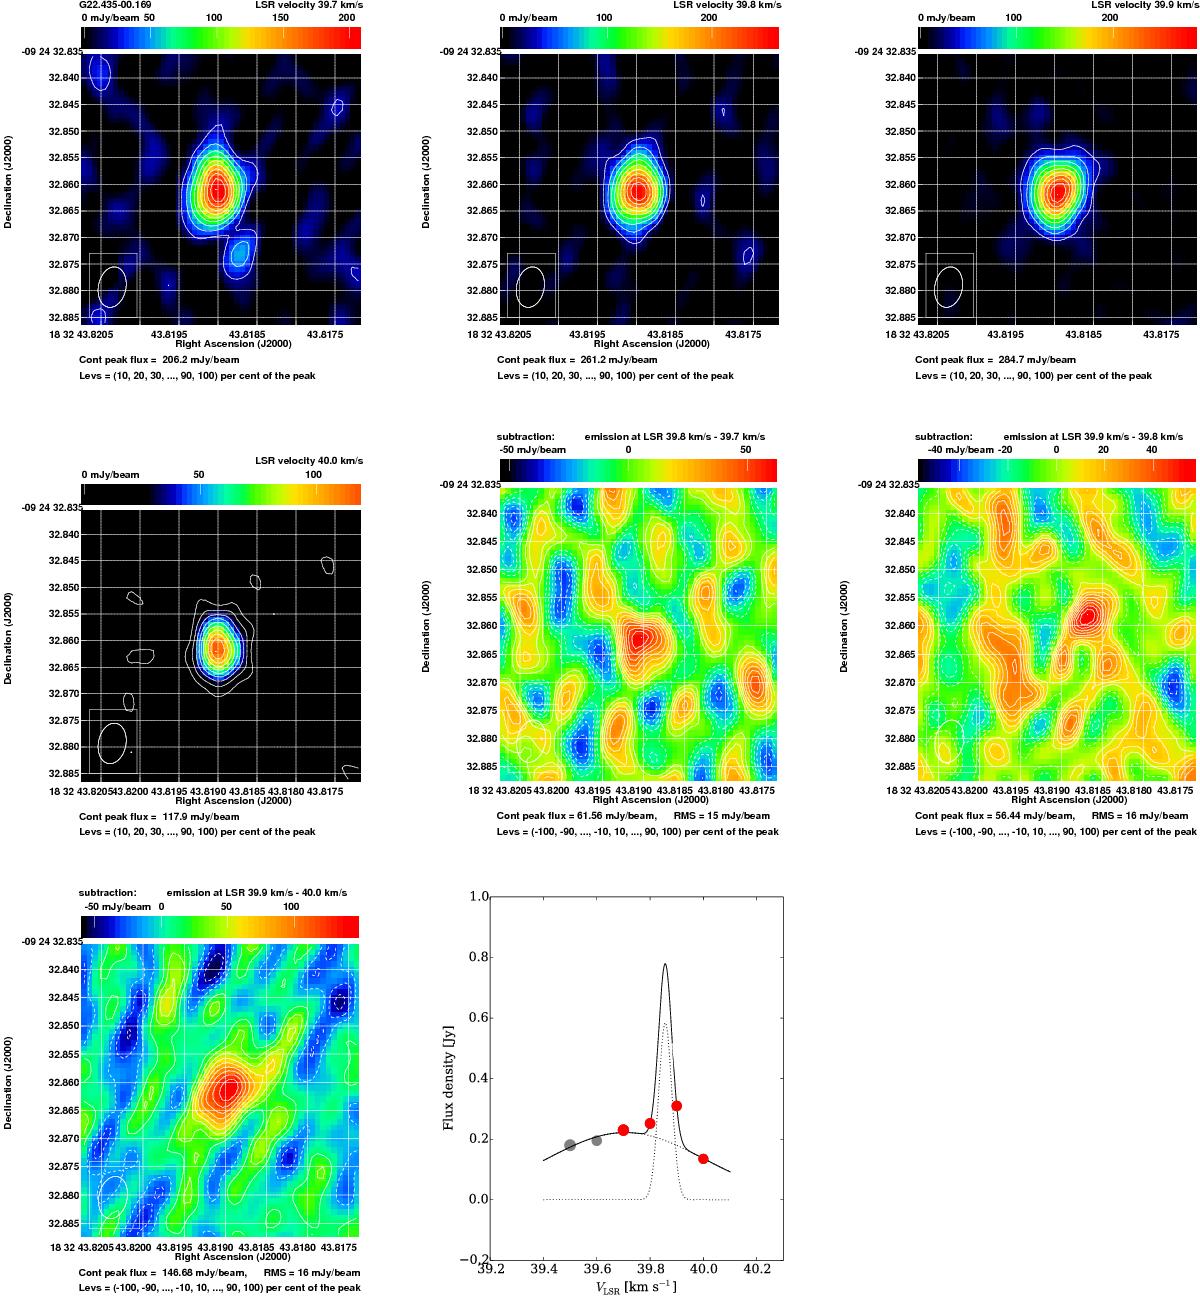
Four of the brightest maser spots from Cloud 1 of G22.435−00.169. They are indicated by red dots in the spectrum presented in the bottom panel. Their LSR velocities are given above each image. Three further images in the middle and bottom panels present the subtraction of emission as indicated above each image. The synthesized beam is presented in the left bottom corner of each image and the noise level is also given. The dot diameters in the spectrum are proportional to the deconvolved size of the maser spot.
Current usage metrics show cumulative count of Article Views (full-text article views including HTML views, PDF and ePub downloads, according to the available data) and Abstracts Views on Vision4Press platform.
Data correspond to usage on the plateform after 2015. The current usage metrics is available 48-96 hours after online publication and is updated daily on week days.
Initial download of the metrics may take a while.