Fig. B.1
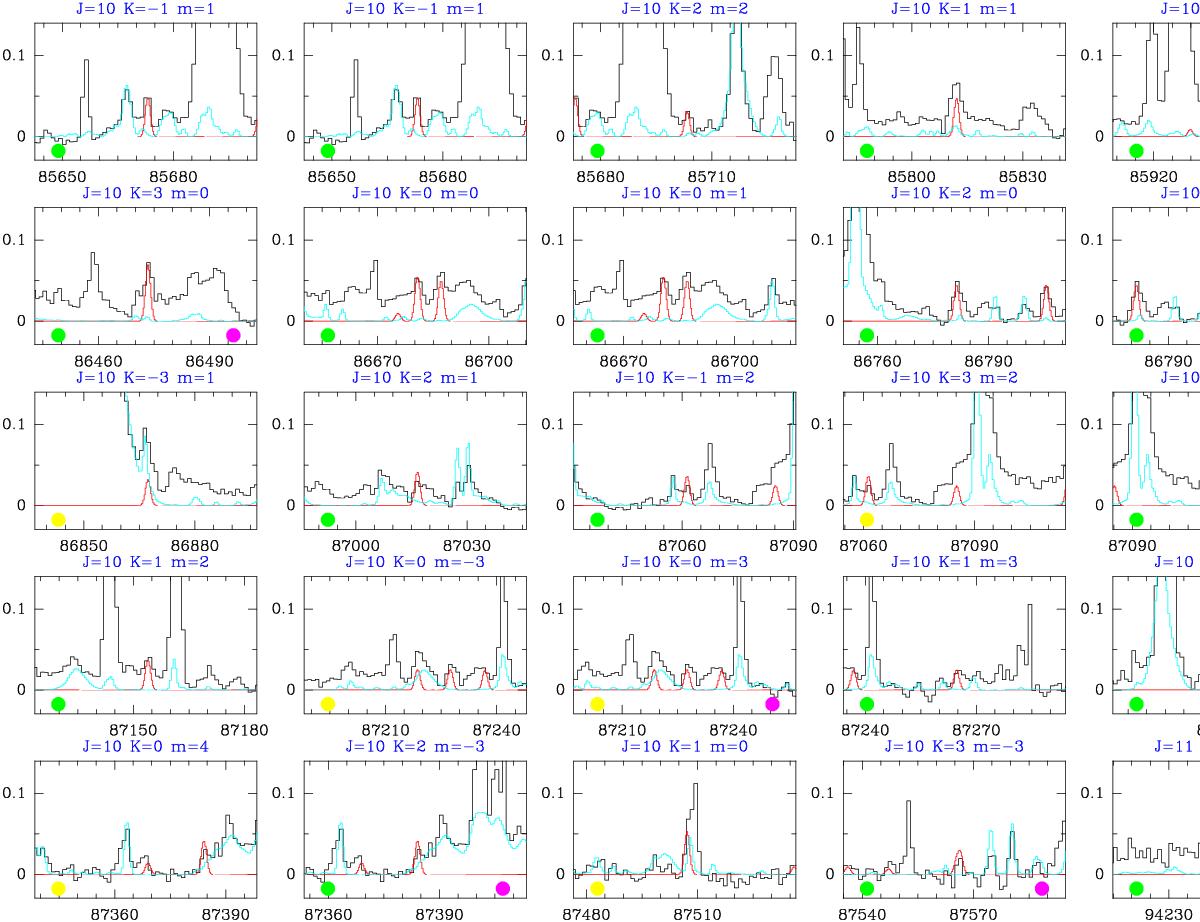
Lines of CH3NCO (here and the next 15 plots) observed with the IRAM 30 m telescope and with ALMA (black filled circle in the middle bottom of each panel). The lines are ordered by frequency. The red lines correspond to the CH3NCO model simulation for both sets of data (see text). The cyan lines correspond to the emission of all modelled molecules to date for the 30m data (see Table B.3). Green filled circles at the bottom left of each panel identify unblended lines, while yellow ones mark lines blended with similar intensity lines from other species. Nevertheless, in the latter case each line profile can be still fitted with a Gaussian profile providing a frequency and intensity for the observed component. Violet filled circles at the bottom right of each panel identify to unresolved doublets. The quantum numbers follow the labelling of Table A.5 except for m = 0 for which Kc is not provided (many of these lines are unresolved doublets). The complete set of quantum numbers for m = 0 is provided in Table A.6. The units for the intensity scale are Jy/beam for the ALMA data and main beam antenna temperature for the IRAM 30 m telescope. A vLSR of +9.0 km s-1 is assumed.
Current usage metrics show cumulative count of Article Views (full-text article views including HTML views, PDF and ePub downloads, according to the available data) and Abstracts Views on Vision4Press platform.
Data correspond to usage on the plateform after 2015. The current usage metrics is available 48-96 hours after online publication and is updated daily on week days.
Initial download of the metrics may take a while.