Fig. A.1
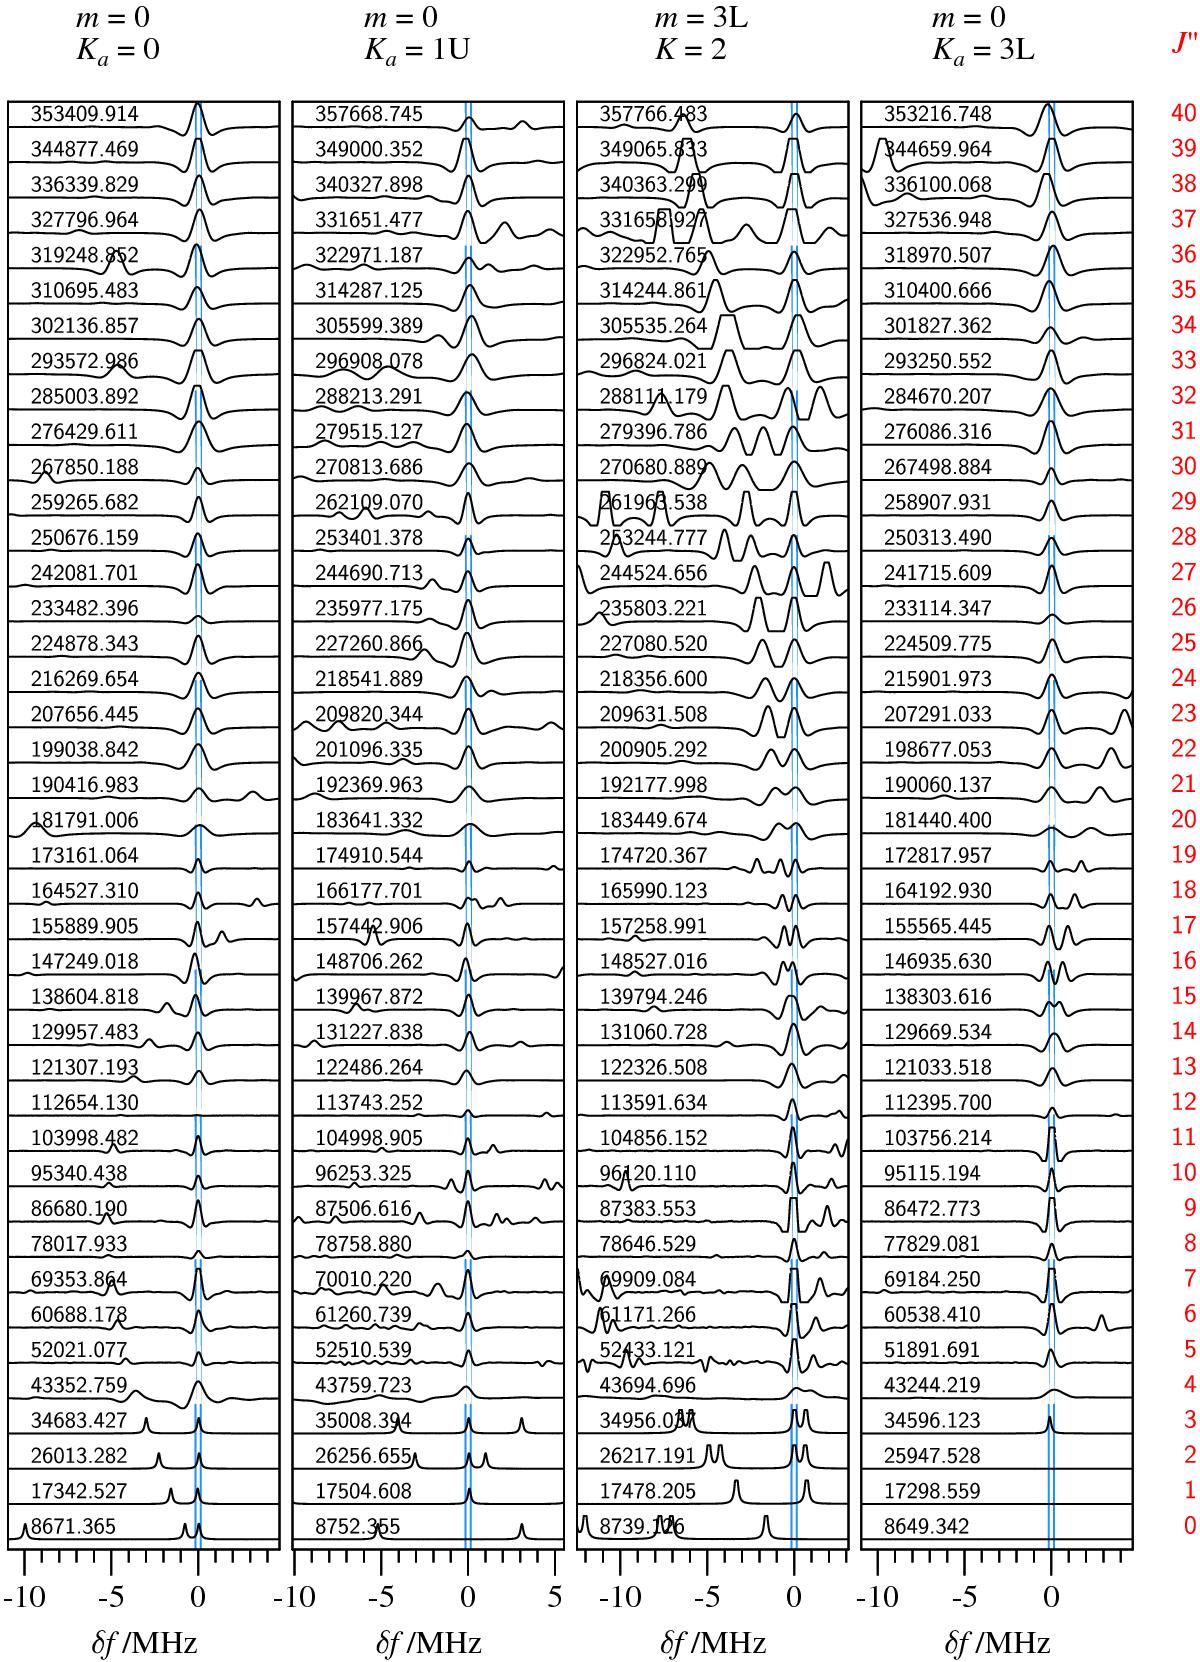
Sample Loomis-Wood type plots of the rotational spectrum of CH3NCO for several assigned line sequences for νb = 0 where sections of the experimental spectrum are plotted around the indicated centre frequencies from the linear-type fits. The plots illustrate how the assignments reached with Stark spectroscopy at J′′ ≤ 3 could be unambiguously transferred to the millimetre wave region. The blue lines mark the estimated frequency uncertainty.
Current usage metrics show cumulative count of Article Views (full-text article views including HTML views, PDF and ePub downloads, according to the available data) and Abstracts Views on Vision4Press platform.
Data correspond to usage on the plateform after 2015. The current usage metrics is available 48-96 hours after online publication and is updated daily on week days.
Initial download of the metrics may take a while.