Fig. 3
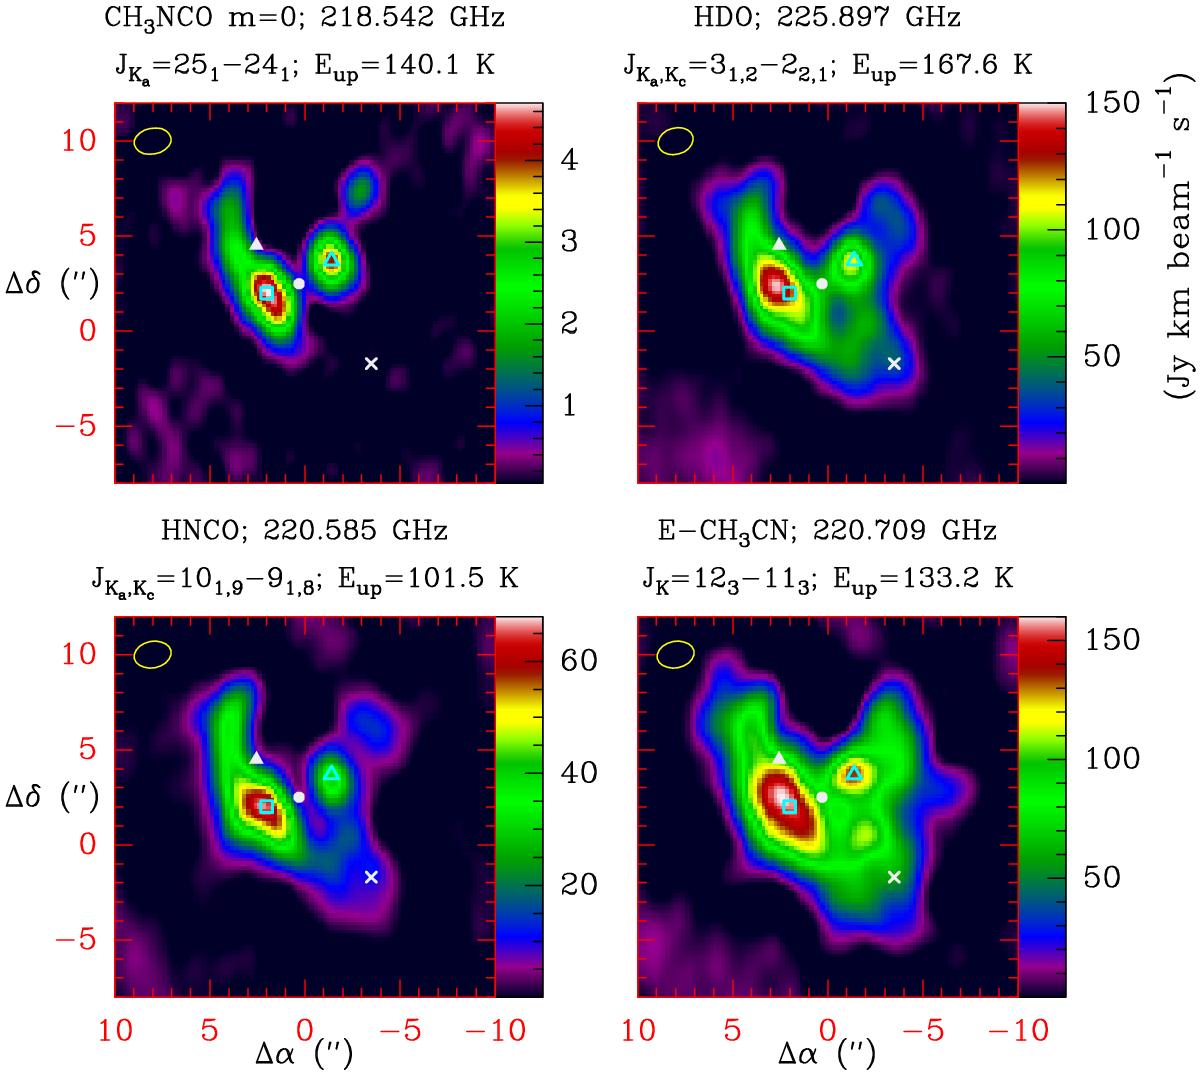
Spatial distribution of CH3NCO (top left panel) together with those of several molecular species as identified at the top of each panel. The data are from ALMA Science Verification observations. The different positions discussed in the text are indicated by symbols (white triangle: source I; white circle: source n; ×: the compact ridge; cyan unfilled square/triangle: Positions A/B, which are the two emission peaks of CH3NCO). Additional molecular emission maps are shown in Fig. B.3.
Current usage metrics show cumulative count of Article Views (full-text article views including HTML views, PDF and ePub downloads, according to the available data) and Abstracts Views on Vision4Press platform.
Data correspond to usage on the plateform after 2015. The current usage metrics is available 48-96 hours after online publication and is updated daily on week days.
Initial download of the metrics may take a while.