Fig. 2
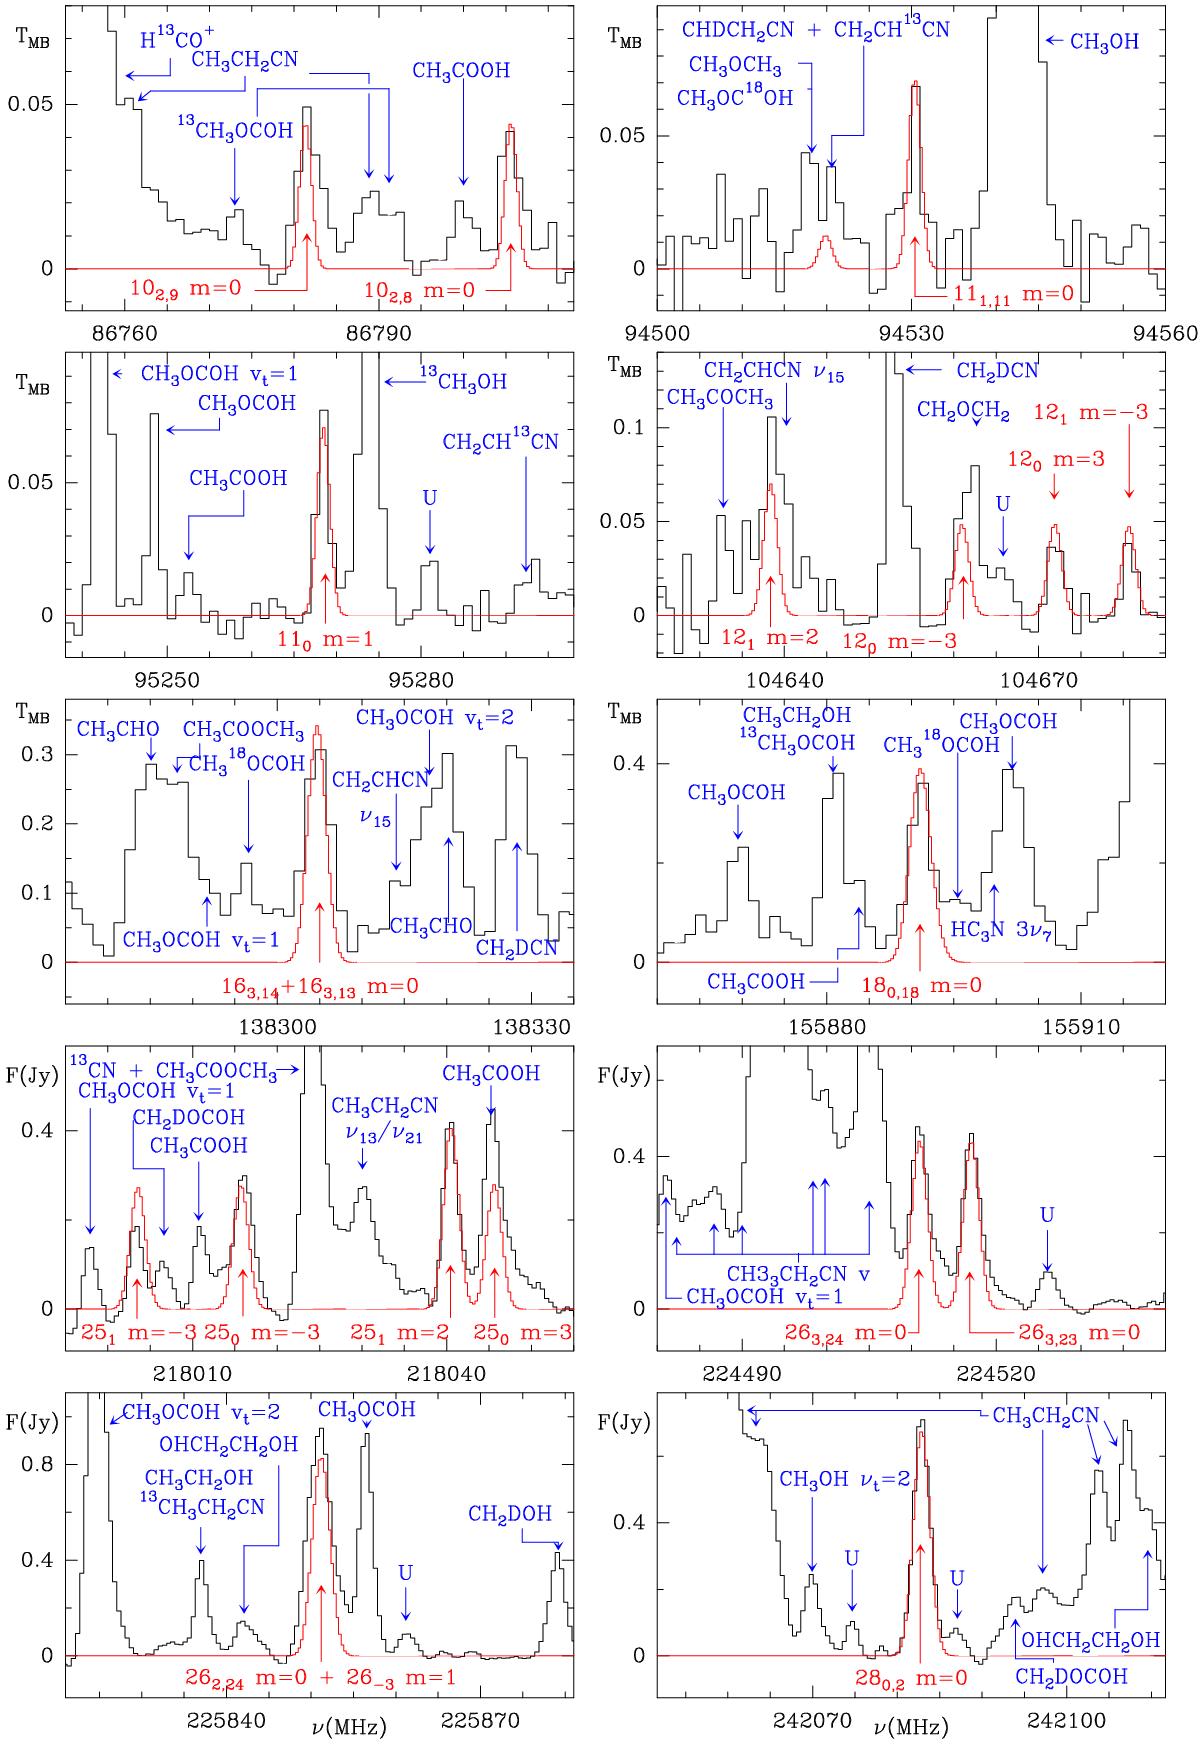
Selected lines of CH3NCO as observed with the IRAM 30 m radio telescope (toward the IRc2 source at α2000.0 = 5h35m14![]() 5, δ2000.0 = −5°22′30.′′0, 0.5′′north to source I, see Fig. 3) and the ALMA interferometer (Position A, see Fig. 3). The red lines show the model of CH3NCO emission discussed in the text. Red labels show the quantum numbers of the corresponding lines. Blue labels show the species responsible for the other features observed in each panel. The complete set of detected lines of CH3NCO is shown in Fig. B.1. The intensity units for the last four panels (ALMA data) are in Jy/beam. They can be transformed into brightness temperature, TB, by multiplying the intensities by a factor of 9. The intensity scale for the 30 m IRAM telescope is the main-beam antenna temperature in K.
5, δ2000.0 = −5°22′30.′′0, 0.5′′north to source I, see Fig. 3) and the ALMA interferometer (Position A, see Fig. 3). The red lines show the model of CH3NCO emission discussed in the text. Red labels show the quantum numbers of the corresponding lines. Blue labels show the species responsible for the other features observed in each panel. The complete set of detected lines of CH3NCO is shown in Fig. B.1. The intensity units for the last four panels (ALMA data) are in Jy/beam. They can be transformed into brightness temperature, TB, by multiplying the intensities by a factor of 9. The intensity scale for the 30 m IRAM telescope is the main-beam antenna temperature in K.
Current usage metrics show cumulative count of Article Views (full-text article views including HTML views, PDF and ePub downloads, according to the available data) and Abstracts Views on Vision4Press platform.
Data correspond to usage on the plateform after 2015. The current usage metrics is available 48-96 hours after online publication and is updated daily on week days.
Initial download of the metrics may take a while.