Fig. 3
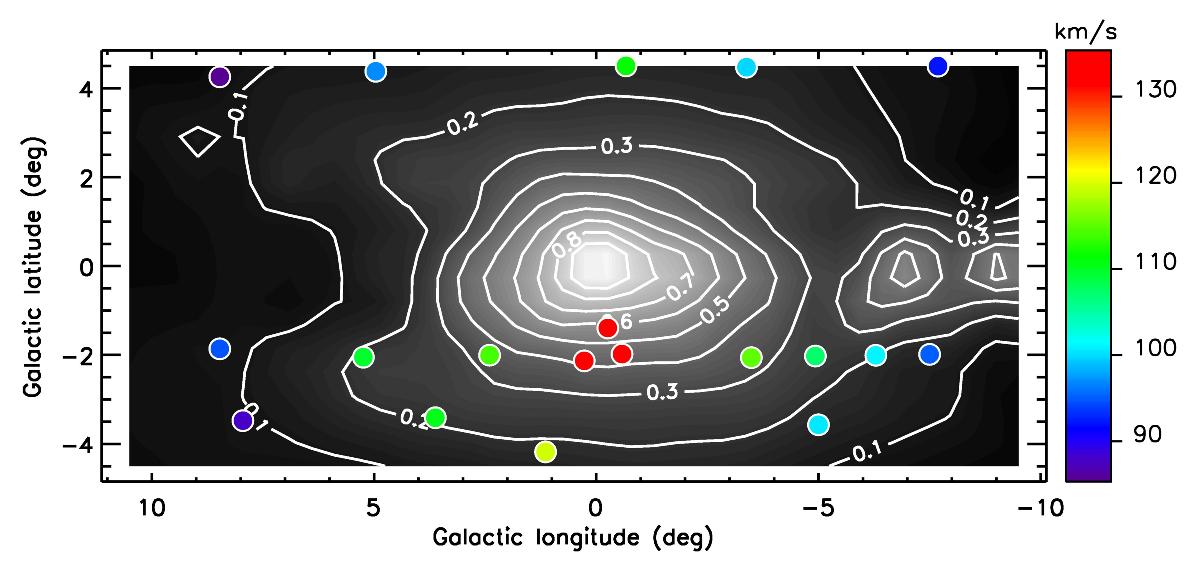
Density map in the longitude-latitude plane based on RC star counts. Star counts have been normalized to the maximum (Max). Solid contours are isodensity curves, linearly spaced by 0.1 × Max deg-2. The fields observed by GIBS are shown as circles, whose colors follow the measured velocity dispersion (σ in km s-1) in that given field.
Current usage metrics show cumulative count of Article Views (full-text article views including HTML views, PDF and ePub downloads, according to the available data) and Abstracts Views on Vision4Press platform.
Data correspond to usage on the plateform after 2015. The current usage metrics is available 48-96 hours after online publication and is updated daily on week days.
Initial download of the metrics may take a while.