Fig. 5
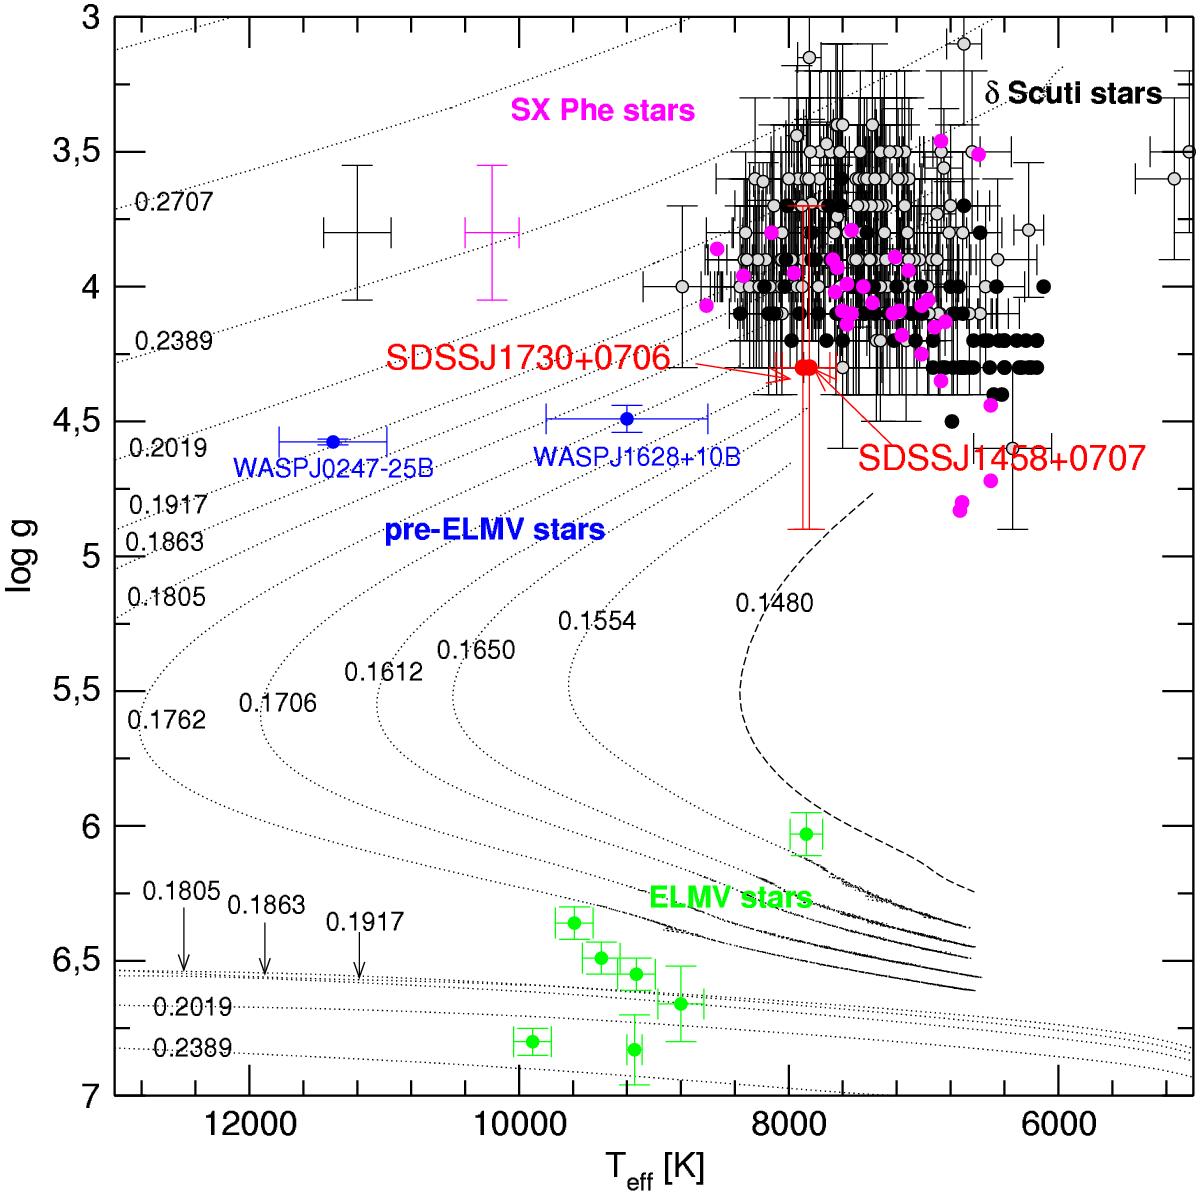
Location of the stars SDSS J1730+0706 and SDSS J1458+0707 in the Teff − log g plane, with samples of other classes of variable stars (see the text). The crosses on the left side indicate the error of the black and pink dots. The extremely short−lived stages during the CNO flashes episodes of M⋆> 0.1762 M⊙ are not shown in the figure.
Current usage metrics show cumulative count of Article Views (full-text article views including HTML views, PDF and ePub downloads, according to the available data) and Abstracts Views on Vision4Press platform.
Data correspond to usage on the plateform after 2015. The current usage metrics is available 48-96 hours after online publication and is updated daily on week days.
Initial download of the metrics may take a while.