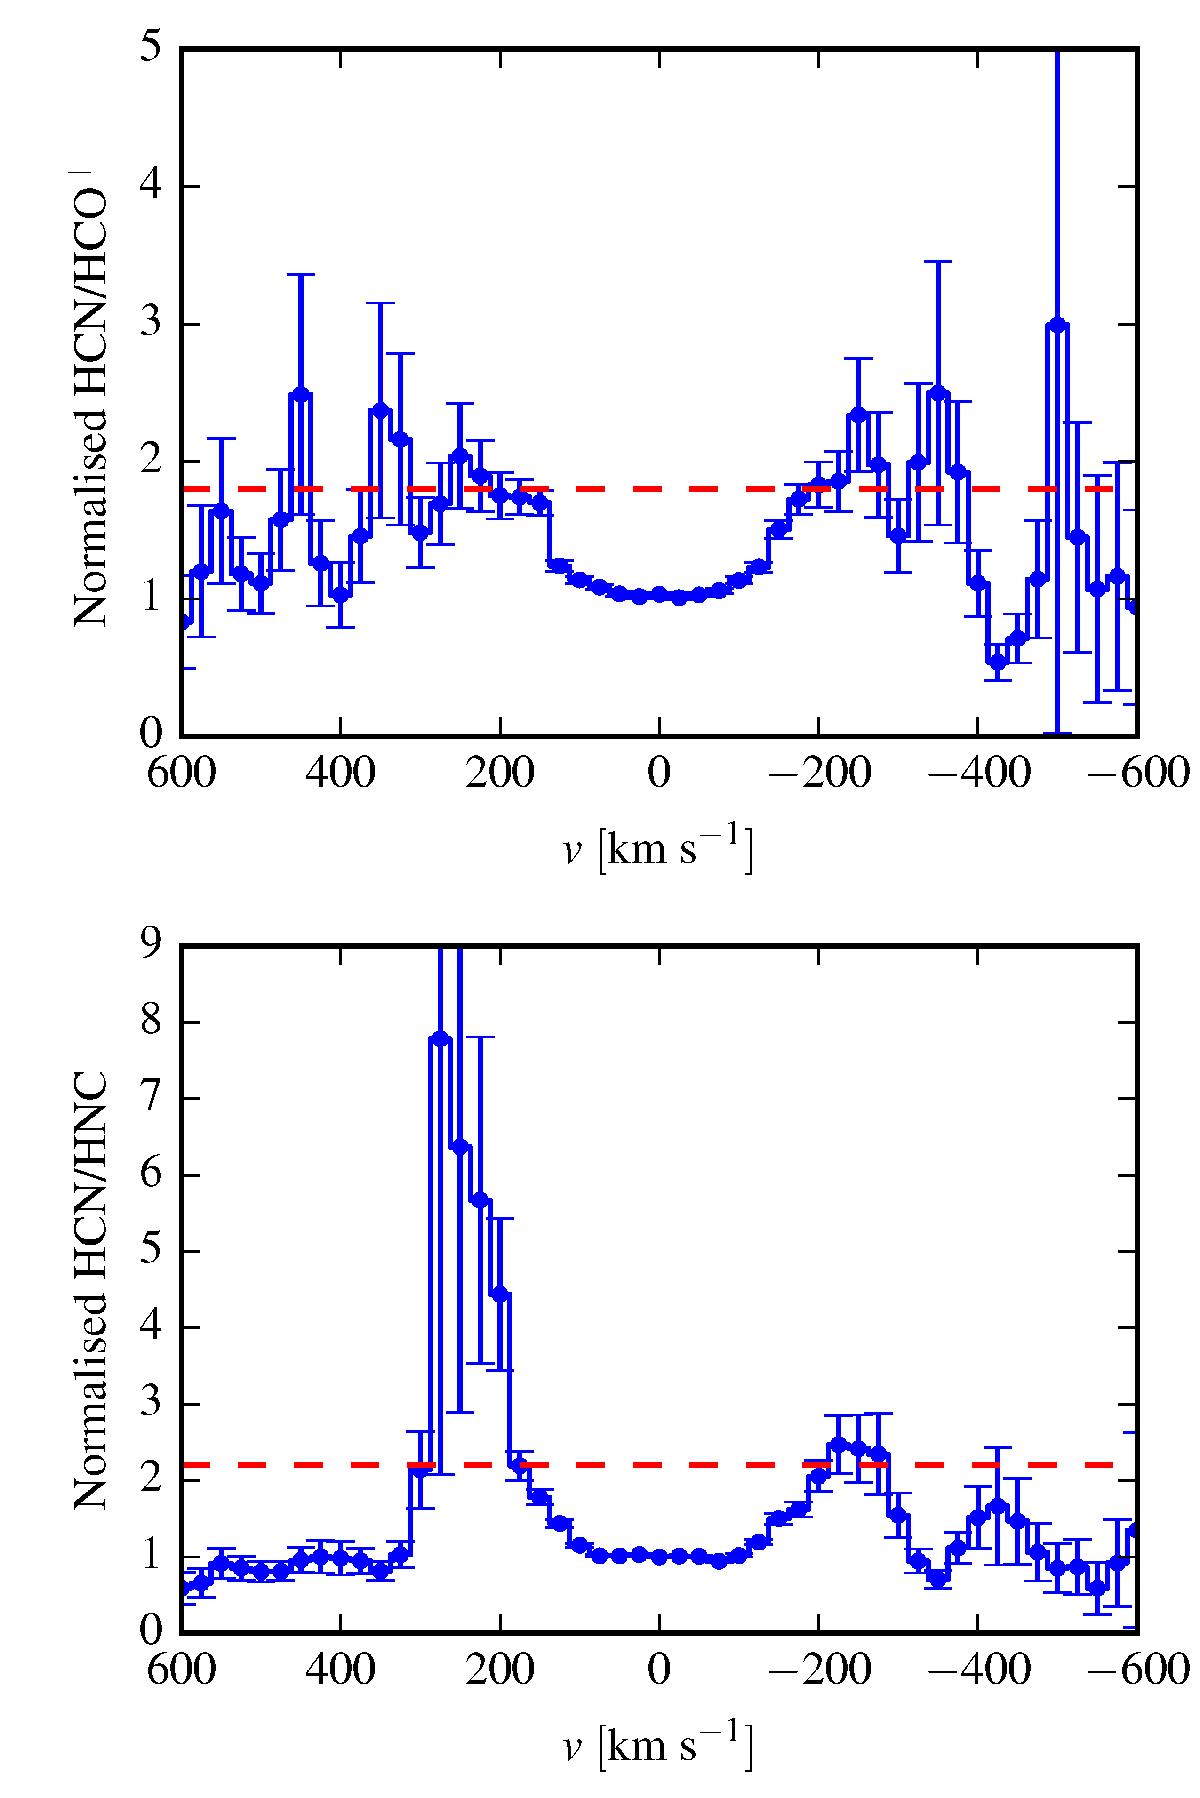
Fig. 3

Combined normalised HCN and HCO+ line flux ratios (top panel) and the corresponding HCN and HNC ratios (bottom panel) from Fig. 2 are plotted as a function of velocity. Since the fluxes are normalised, the ratio is per definition 1 at 0 km s-1. Error bars are 1σ (statistical errors only). The red dashed lines show the line core ratio assuming that both species are optically thin towards the edge of the line core (at ± 200 km s-1). We note that the y-axes of the graphs show neither line ratios nor abundance ratios.
Current usage metrics show cumulative count of Article Views (full-text article views including HTML views, PDF and ePub downloads, according to the available data) and Abstracts Views on Vision4Press platform.
Data correspond to usage on the plateform after 2015. The current usage metrics is available 48-96 hours after online publication and is updated daily on week days.
Initial download of the metrics may take a while.


