Fig. 1
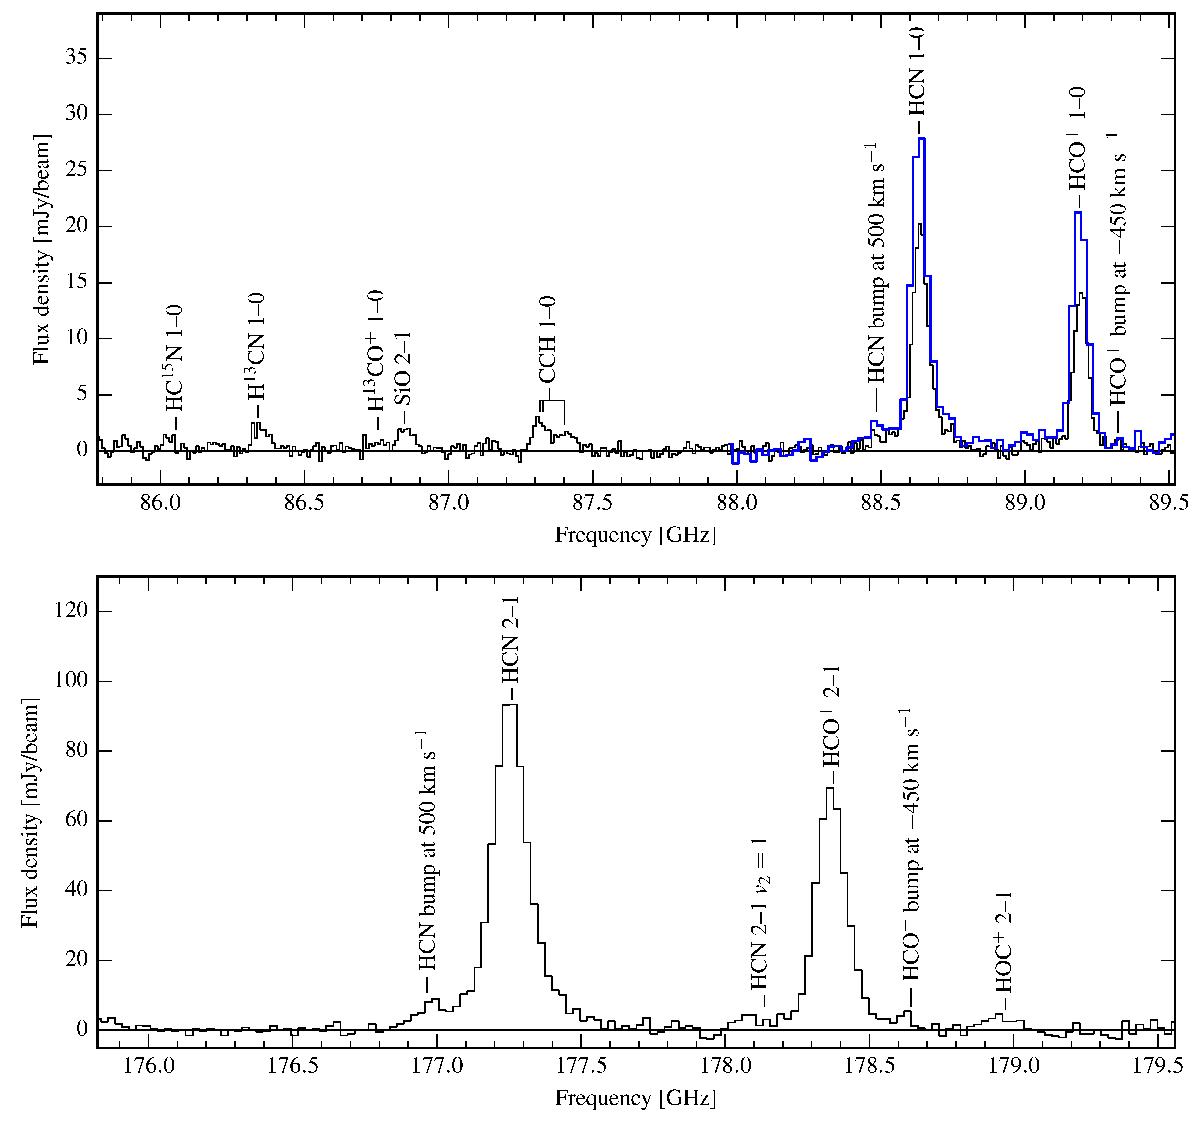
Top: 3 mm A-array (black line) and B-array (thick blue line; Aalto et al. 2012a) spectra of Mrk 231 towards the central beam. Bottom: 2 mm D-array spectrum. The frequency of the HCN 2–1 v2 = 1 line is indicated in the plot, but this line is not significantly detected. Both figures: the most prominent outflow bumps of HCN and HCO+ emission are also indicated. The frequency axes of the two spectra are corrected for the redshift of the source (z = 0.042170). The beam sizes can be found in Table 1.
Current usage metrics show cumulative count of Article Views (full-text article views including HTML views, PDF and ePub downloads, according to the available data) and Abstracts Views on Vision4Press platform.
Data correspond to usage on the plateform after 2015. The current usage metrics is available 48-96 hours after online publication and is updated daily on week days.
Initial download of the metrics may take a while.