Fig. 9
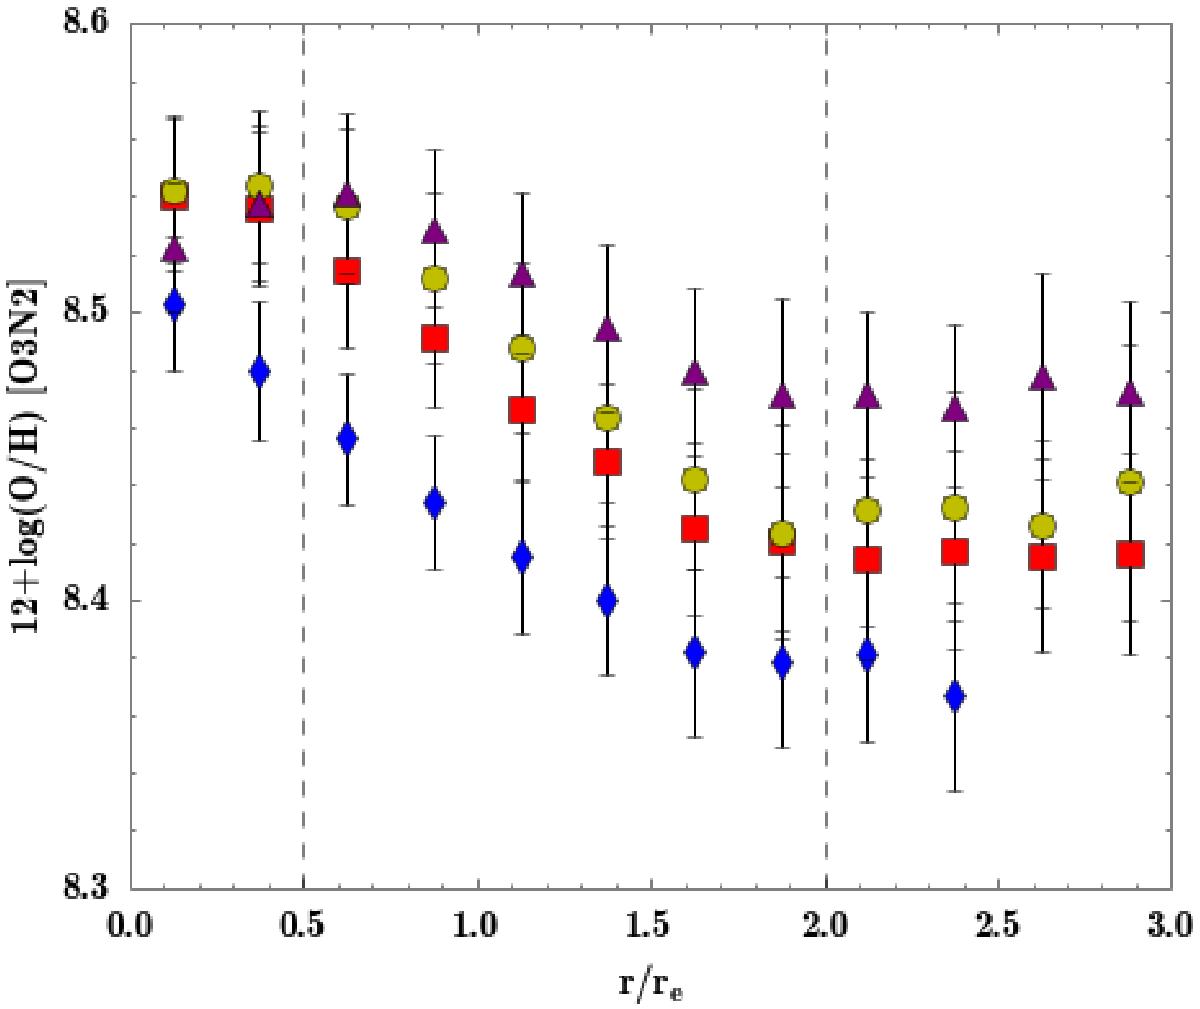
Mean oxygen abundance radial profiles derived considering galaxies in four different bins according to their integrated stellar mass. The limits of the bins were chosen to ensure a similar number of elements in each bin: log (M/M⊙) ≤ 10.2, blue diamonds; 10.2 < log (M/M⊙) ≤ 10.5, red squares; 10.5 < log (M/M⊙) ≤ 10.75, yellow dots; log (M/M⊙) ≥ 10.75, purple triangles. The symbols represent the mean oxygen abundance values, with the error bars indicating the corresponding standard deviations, for bins of 0.25 re. Dashed vertical lines delimit the three different behaviours in the oxygen abundance profiles (i.e. drop in the inner parts, common gradient between 0.5 and 2.0 re, and the flattening in the outer parts).
Current usage metrics show cumulative count of Article Views (full-text article views including HTML views, PDF and ePub downloads, according to the available data) and Abstracts Views on Vision4Press platform.
Data correspond to usage on the plateform after 2015. The current usage metrics is available 48-96 hours after online publication and is updated daily on week days.
Initial download of the metrics may take a while.