Fig. 8
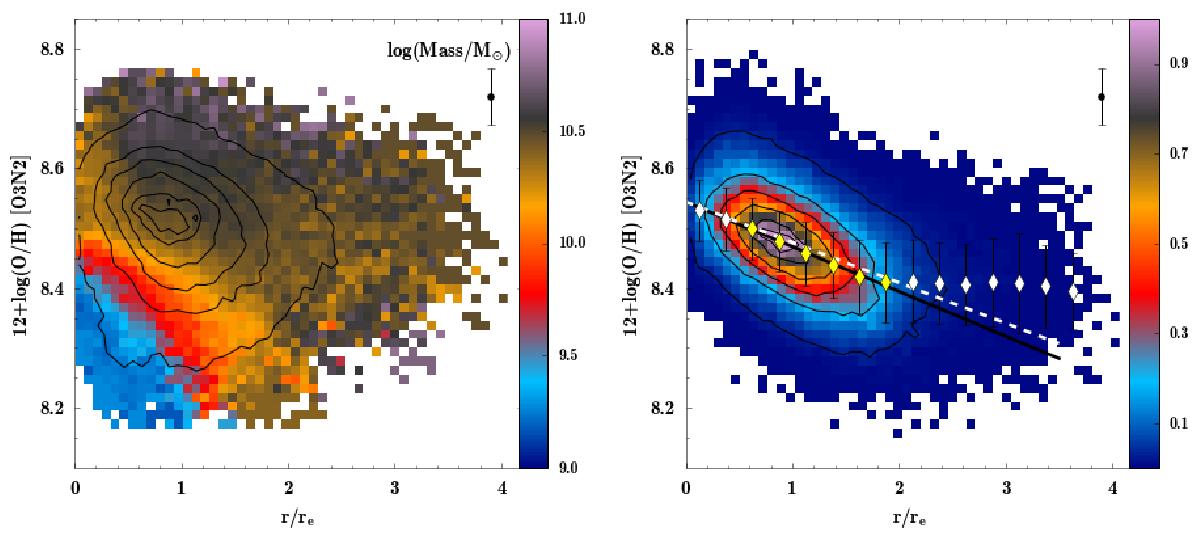
Left: radial distribution of the oxygen abundance derived using the O3N2 indicator and the calibration proposed by M13 for all the galaxies in our sample. The black contours show the density distribution of the star-forming spaxels, the outermost one including 95% of the total number of spaxels and decreasing 20% in each consecutive contour. The colour bar displays the average stellar mass of each galaxy (in log scale) corresponding to each abundance and radial distance. The average error of the derived oxygen abundances is indicated as an error bar located at the top right side of the panel. For clarity, only the oxygen abundance values with a contribution of at least 1% of the total number of spaxels are plotted. Right: radial density distribution of the oxygen abundance after rescaling the oxygen abundances of each galaxy following the ![]() relation derived in Sánchez et al. (2013). As in the left panel, the outermost contour encircles 95% of the total number of spaxels, decreasing 20% in each consecutive contour. The diamonds represent the mean oxygen abundance values, with the error bars indicating the corresponding standard deviations, for bins of 0.25 re. The solid-black line represents the error-weighted linear fit derived for those mean values within the range between 0.5 and 2.0 re (yellow diamonds), and the dashed white line represents the linear relation corresponding to the characteristic values of the zero-points and slopes derived in Sect. 4.1 for the individual galaxies assuming a Gaussian distribution for both parameters.
relation derived in Sánchez et al. (2013). As in the left panel, the outermost contour encircles 95% of the total number of spaxels, decreasing 20% in each consecutive contour. The diamonds represent the mean oxygen abundance values, with the error bars indicating the corresponding standard deviations, for bins of 0.25 re. The solid-black line represents the error-weighted linear fit derived for those mean values within the range between 0.5 and 2.0 re (yellow diamonds), and the dashed white line represents the linear relation corresponding to the characteristic values of the zero-points and slopes derived in Sect. 4.1 for the individual galaxies assuming a Gaussian distribution for both parameters.
Current usage metrics show cumulative count of Article Views (full-text article views including HTML views, PDF and ePub downloads, according to the available data) and Abstracts Views on Vision4Press platform.
Data correspond to usage on the plateform after 2015. The current usage metrics is available 48-96 hours after online publication and is updated daily on week days.
Initial download of the metrics may take a while.