Fig. 6
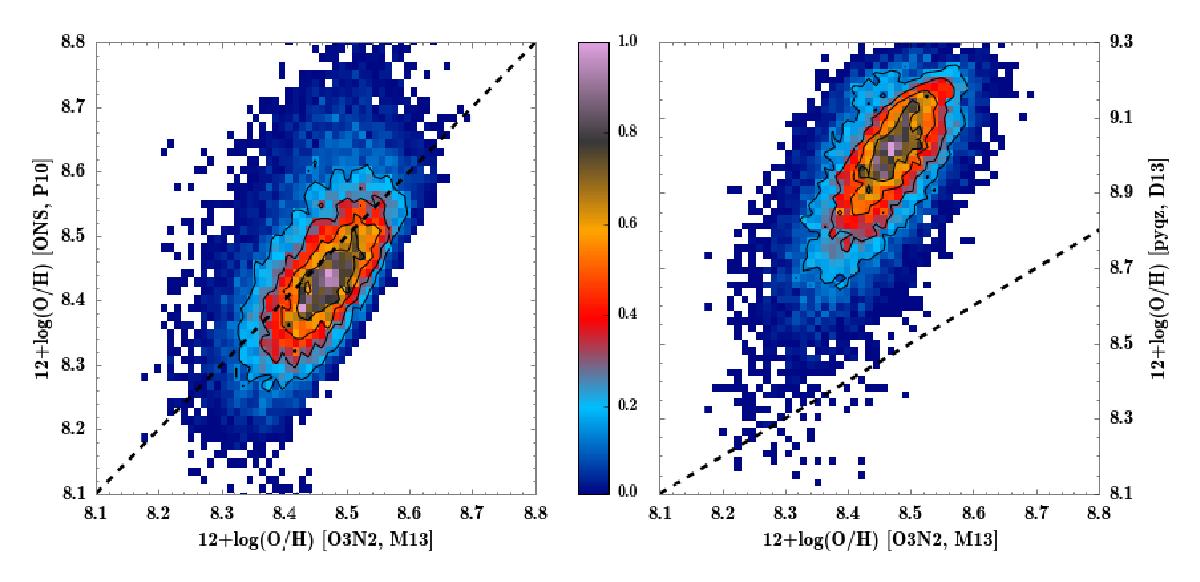
Comparison of the oxygen abundance distribution derived using the calibration proposed by M13 for the O3N2 index with the distribution derived using the P10 calibration for the ONS index (left panel) and the calibration based on pyqz code (D13, right panel). The black contours show the density distribution of the SF spaxels, the outermost one including 80% of the total number of spaxels and decreasing 20% in each consecutive contour. The black dashed lines indicate the 1:1 relation between the represented calibrators.
Current usage metrics show cumulative count of Article Views (full-text article views including HTML views, PDF and ePub downloads, according to the available data) and Abstracts Views on Vision4Press platform.
Data correspond to usage on the plateform after 2015. The current usage metrics is available 48-96 hours after online publication and is updated daily on week days.
Initial download of the metrics may take a while.