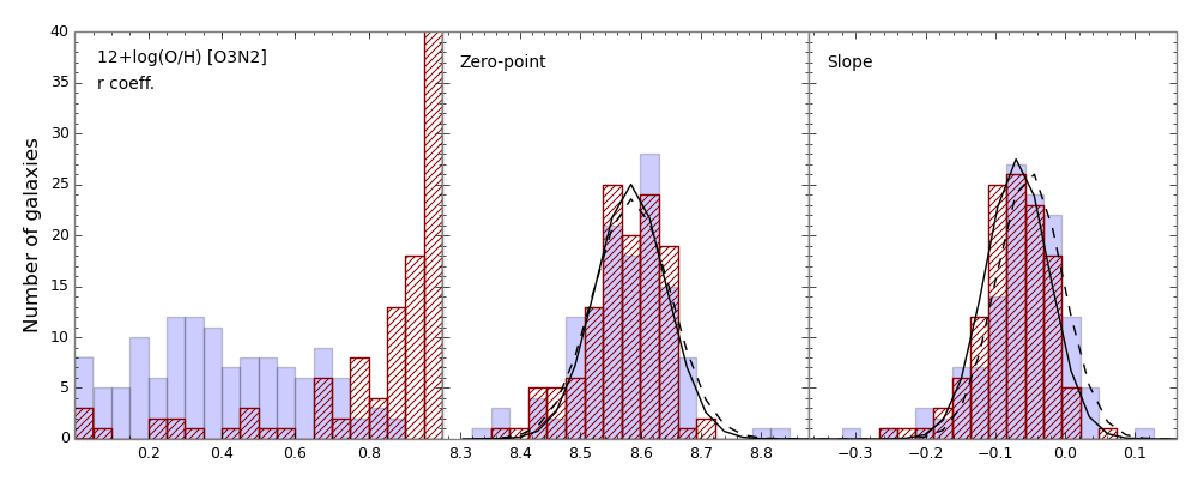
Fig. 5

Distribution of correlation coefficients (left panel), zero points (middle panel), and slopes (right panel) of the linear fits derived for the oxygen abundance gradients of the final sample using spaxel-wise information (dashed red bars) and the individual H ii regions (filled blue bars). For both the zero point and slope distributions the lines represent the Gaussian distribution of the data (solid line for spaxels, dashed line for individual H ii regions), assuming the mean and standard-deviation of the distribution of each analysed parameter and sampled with the same bins.
Current usage metrics show cumulative count of Article Views (full-text article views including HTML views, PDF and ePub downloads, according to the available data) and Abstracts Views on Vision4Press platform.
Data correspond to usage on the plateform after 2015. The current usage metrics is available 48-96 hours after online publication and is updated daily on week days.
Initial download of the metrics may take a while.


