Fig. 4
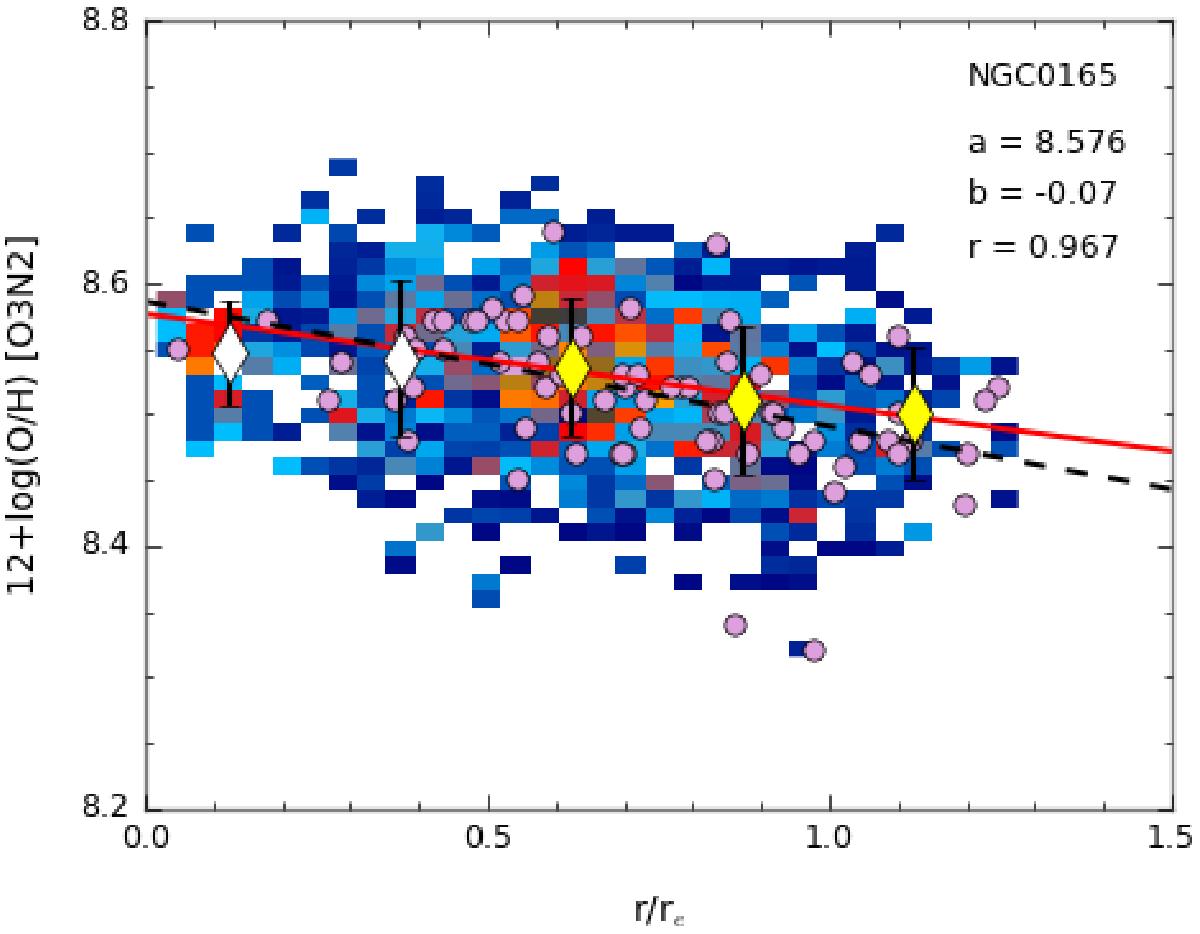
Radial density distribution of the spaxels in the oxygen abundance-galactocentric distance space for the same galaxy as in Fig. 3 (right panels). The radial distances are deprojected and normalised to the disc effective radius. The diamonds represent the mean oxygen abundance values, with the error bars representing the corresponding standard deviations, for bins of 0.25 re and the red solid line the error-weighted linear fit derived for values within the range between 0.5 and 2.0 re (yellow diamonds). The parameters of the fit are shown in the upper right corner of the panels, including the zero point (a), the slope (b) and the correlation coefficient (r). The violet dots correspond to the oxygen abundances derived for the individual H ii regions, and the dashed black line is the linear regression for these points.
Current usage metrics show cumulative count of Article Views (full-text article views including HTML views, PDF and ePub downloads, according to the available data) and Abstracts Views on Vision4Press platform.
Data correspond to usage on the plateform after 2015. The current usage metrics is available 48-96 hours after online publication and is updated daily on week days.
Initial download of the metrics may take a while.