Fig. 3
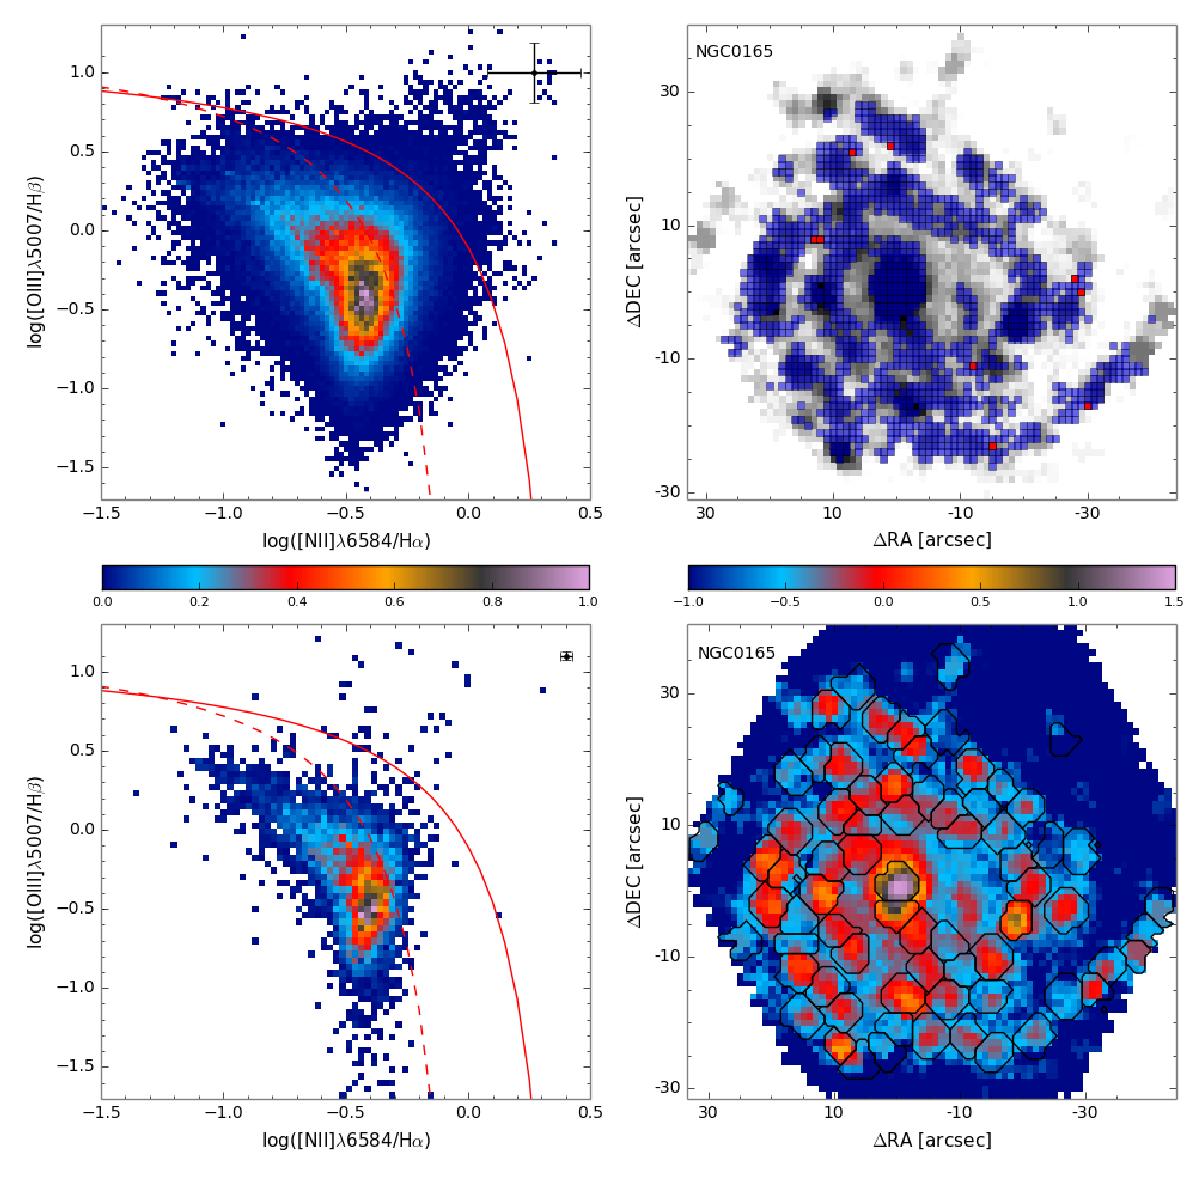
Left panels: normalised density distribution of the spaxels with EW(Hα) above 6 Å (top) and of the detected H ii /SF regions (bottom) along the BPT diagram. The solid and dashed lines in both panels represent the Kewley et al. (2001) and Kauffmann et al. (2003) demarcation curves. SF regions are considered to be below the Kewley et al. (2001) curve. Right panels: location of the spaxels classified as SF regions (blue dots) and AGNs (red dots) according to the BPT diagram superimposed on the IFS-based Hα map derived for one galaxy of the sample, NGC 0165 (top) and a Hα map in units of (log10) 10-16 erg s-1 cm-2 arcsec-1 for NGC 0165, together with the detected H ii regions shown as black segmented contours (bottom).
Current usage metrics show cumulative count of Article Views (full-text article views including HTML views, PDF and ePub downloads, according to the available data) and Abstracts Views on Vision4Press platform.
Data correspond to usage on the plateform after 2015. The current usage metrics is available 48-96 hours after online publication and is updated daily on week days.
Initial download of the metrics may take a while.