Fig. 5
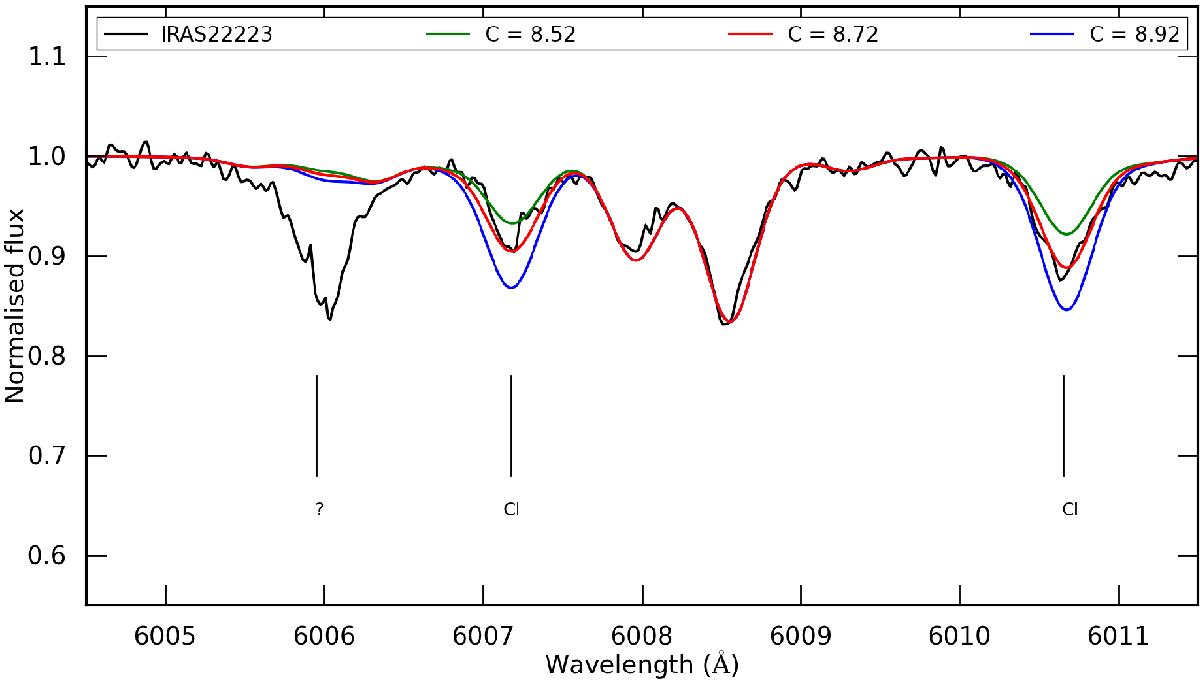
Spectrum synthesis of the C I lines at 6007.176 and 6010.675 Å for IRAS 22223+4327. The black spectrum is the observed HERMES spectrum; the coloured spectra represent synthetic spectra with different C abundances. The red line represents the determined C abundance; the green and blue spectra represent synthetic spectra with a C abundance of −0.2 dex and +0.2 dex, respectively.
Current usage metrics show cumulative count of Article Views (full-text article views including HTML views, PDF and ePub downloads, according to the available data) and Abstracts Views on Vision4Press platform.
Data correspond to usage on the plateform after 2015. The current usage metrics is available 48-96 hours after online publication and is updated daily on week days.
Initial download of the metrics may take a while.