Free Access
Fig. 1
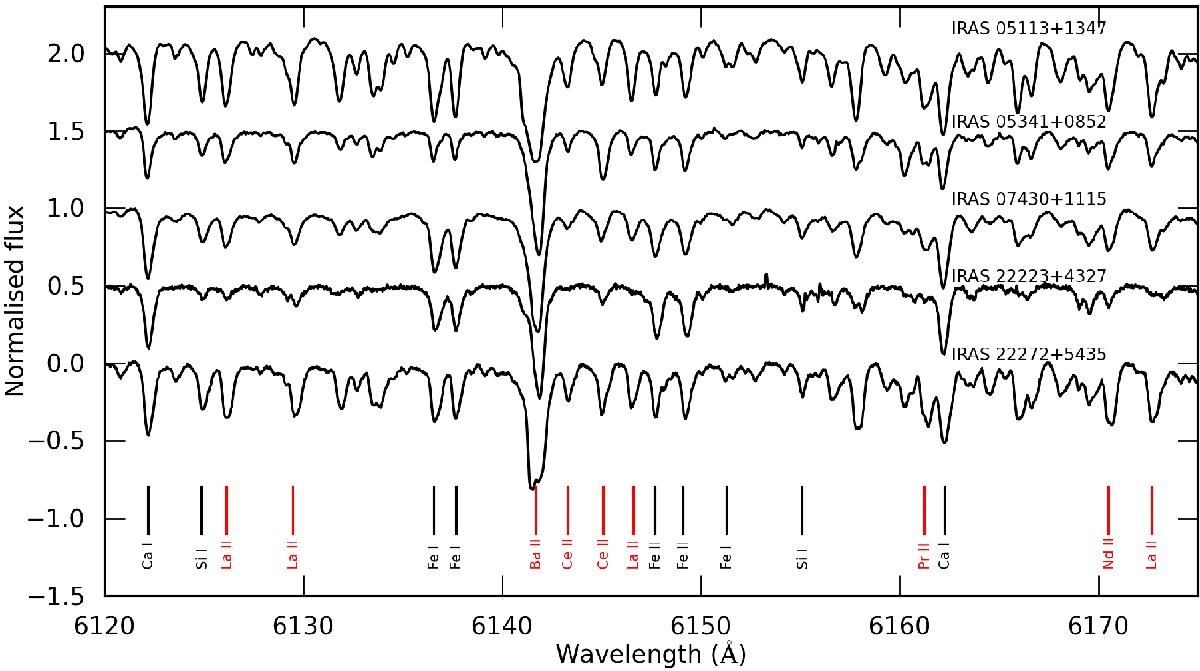
Comparison of the normalised spectra of all sample stars with Teff< 7000 K. The spectra have been shifted in flux for clarity and all spectra are shifted to zero velocity. Red and black vertical lines indicate positions of s nuclei and non s nuclei, respectively. For more information, see text.
Current usage metrics show cumulative count of Article Views (full-text article views including HTML views, PDF and ePub downloads, according to the available data) and Abstracts Views on Vision4Press platform.
Data correspond to usage on the plateform after 2015. The current usage metrics is available 48-96 hours after online publication and is updated daily on week days.
Initial download of the metrics may take a while.