Fig. 4
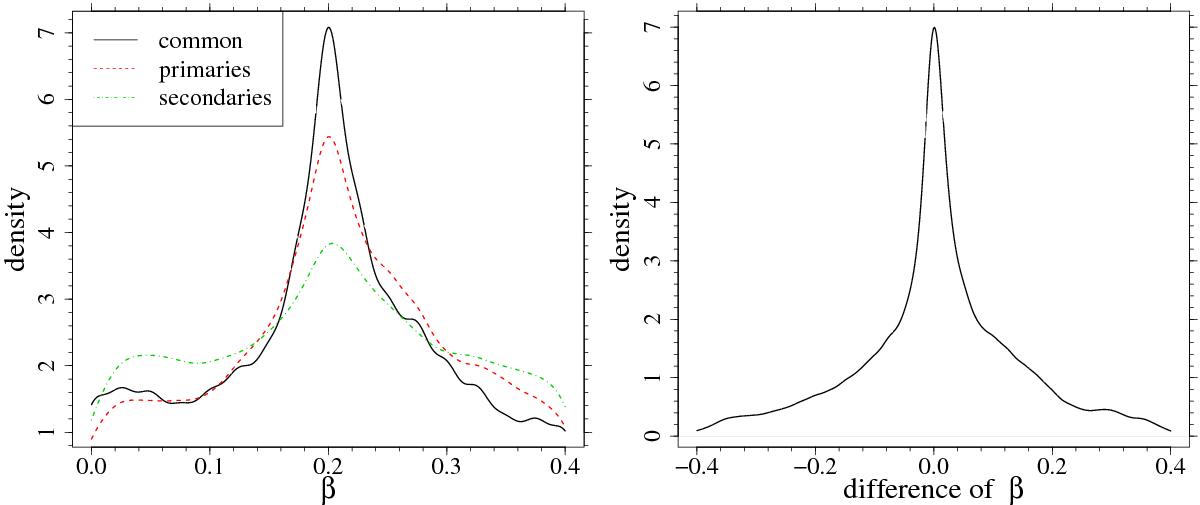
Left: probability density functions for the estimated β from N = 10 000 systems sampled at true β = 0.2. The black solid line corresponds to the estimation performed assuming a common value of β for primary and secondary star; the red dashed line corresponds to the β values for the primary star alone; the greed dot-dashed line to β values for the secondary star alone. Right: probability density function for the differences of the estimated β for primary and secondary stars.
Current usage metrics show cumulative count of Article Views (full-text article views including HTML views, PDF and ePub downloads, according to the available data) and Abstracts Views on Vision4Press platform.
Data correspond to usage on the plateform after 2015. The current usage metrics is available 48-96 hours after online publication and is updated daily on week days.
Initial download of the metrics may take a while.