Fig. 3
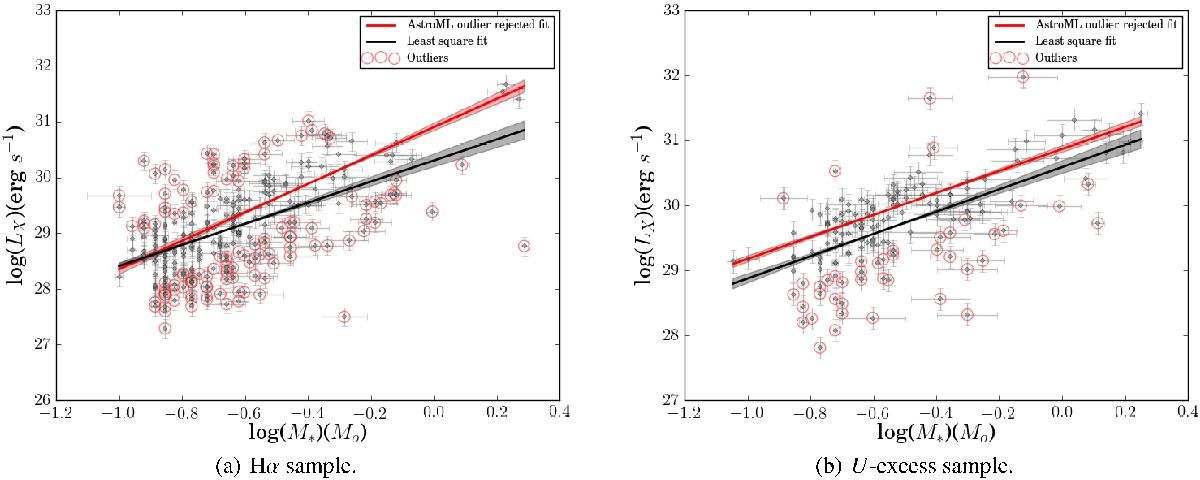
X-ray luminosities vs. the mass of the sources. The plot on the left corresponds to the Hα subsample, and the one on the right to the U-excess subsample. Regression lines (straight) are plotted with their respective errors in the slope (shaded areas) for the OLS regression analysis (black) and the outlier rejection regression method (red).
Current usage metrics show cumulative count of Article Views (full-text article views including HTML views, PDF and ePub downloads, according to the available data) and Abstracts Views on Vision4Press platform.
Data correspond to usage on the plateform after 2015. The current usage metrics is available 48-96 hours after online publication and is updated daily on week days.
Initial download of the metrics may take a while.