Fig. 8
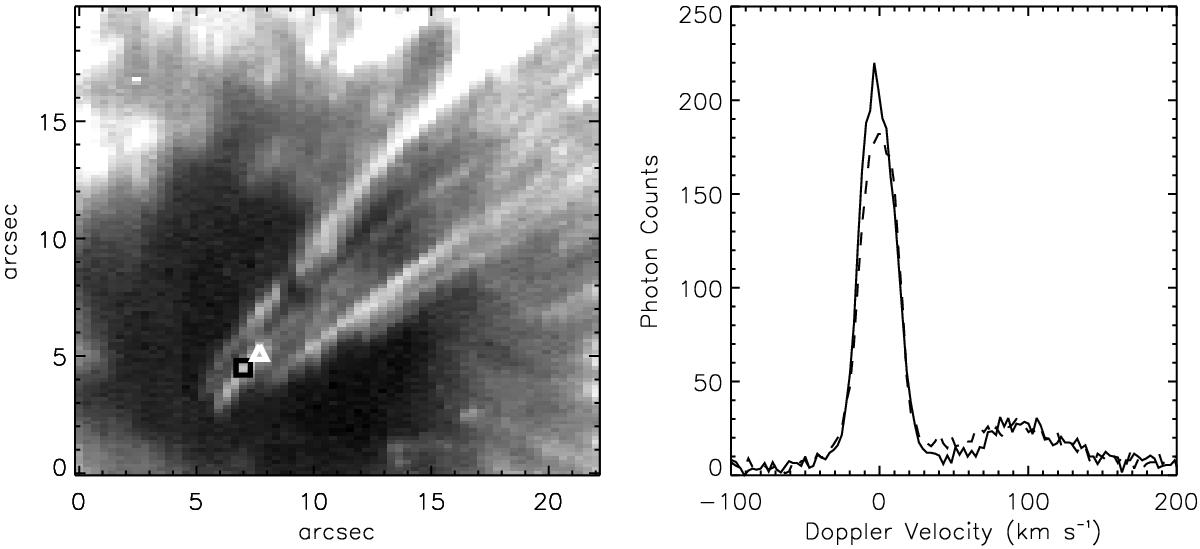
Chromospheric emission from the loop that is rooted in the umbra. The left panel shows a raster map (obtained from 09:37 UT to 09:43 UT) in the red wing of Mg ii k 2796 Å line integrated from 70 km s-1 to 120 km s-1 redshift showing mainly the cool component of the downflowing plasma. The field of view is the same as in Fig. 2 and is indicated by the red rectangle in Fig. 1c. North is left. The right panel shows the Mg ii k line profiles at the two positions marked in the left panel (the solid line corresponds to the position indicated by the square, the dashed line to the triangle). The wavelength is given in Doppler shift units. See Sect. 3.3.
Current usage metrics show cumulative count of Article Views (full-text article views including HTML views, PDF and ePub downloads, according to the available data) and Abstracts Views on Vision4Press platform.
Data correspond to usage on the plateform after 2015. The current usage metrics is available 48-96 hours after online publication and is updated daily on week days.
Initial download of the metrics may take a while.