Fig. 7
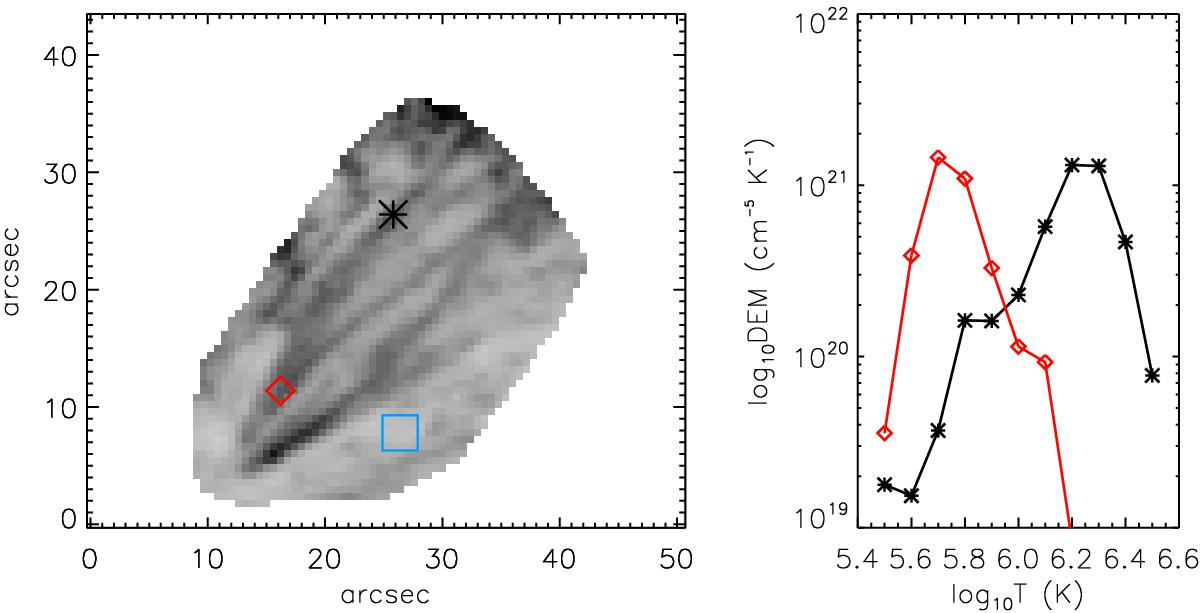
Differential emission measure (DEM) in the loop and close to its footpoint. The left panel shows an AIA 171 Å snapshot (in a negative scale) with various positions marked (red: near the footpoint; black: away from the footpoint along the loop; blue: background region). In the right panel, DEMs resulting from the background subtracted data are plotted for two positions along the umbral loop. Each curve shown here is the median of DEMs with χ2 ≤ 1 that resulted from 300 Monte Carlo iterations. See Sect. 3.2.
Current usage metrics show cumulative count of Article Views (full-text article views including HTML views, PDF and ePub downloads, according to the available data) and Abstracts Views on Vision4Press platform.
Data correspond to usage on the plateform after 2015. The current usage metrics is available 48-96 hours after online publication and is updated daily on week days.
Initial download of the metrics may take a while.