Fig. 5

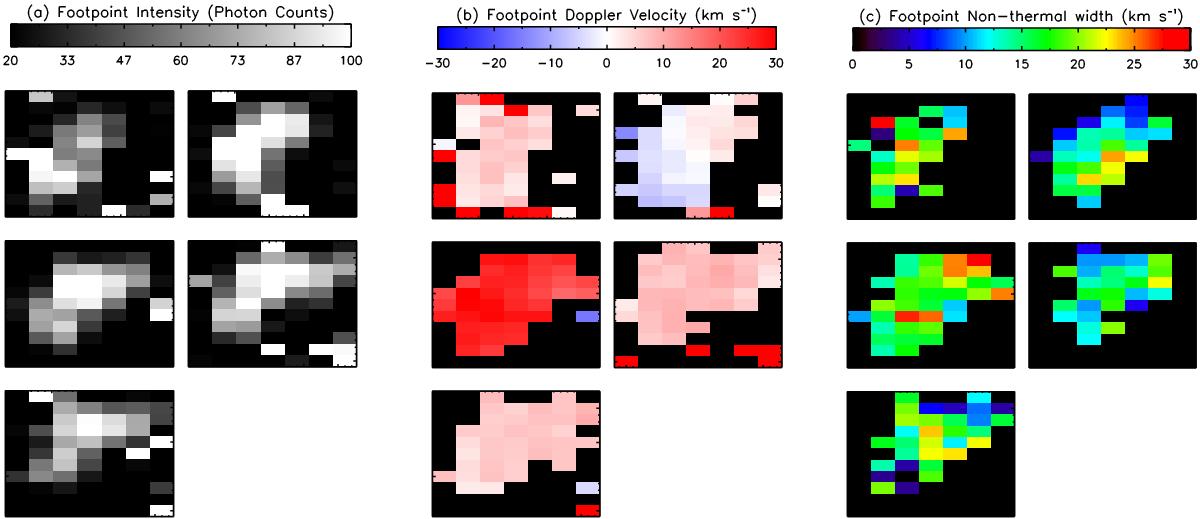
Maps of Si iv line profile parameters. The peak intensity a), Doppler velocity b), and non-thermal width c) have been determined through single-Gaussian fits to the line profile of Si iv at each individual pixel. Each map shows a field of view of ≈![]() that is indicated in Fig. 2d by a yellow rectangle, and that fully encloses one of the footpoints of the coronal loops rooted in the umbra. The time the raster maps are acquired increases from from left to right and top to bottom, with a map cadence of about 340 s. See Sect. 3.1.
that is indicated in Fig. 2d by a yellow rectangle, and that fully encloses one of the footpoints of the coronal loops rooted in the umbra. The time the raster maps are acquired increases from from left to right and top to bottom, with a map cadence of about 340 s. See Sect. 3.1.
Current usage metrics show cumulative count of Article Views (full-text article views including HTML views, PDF and ePub downloads, according to the available data) and Abstracts Views on Vision4Press platform.
Data correspond to usage on the plateform after 2015. The current usage metrics is available 48-96 hours after online publication and is updated daily on week days.
Initial download of the metrics may take a while.


