Fig. 4
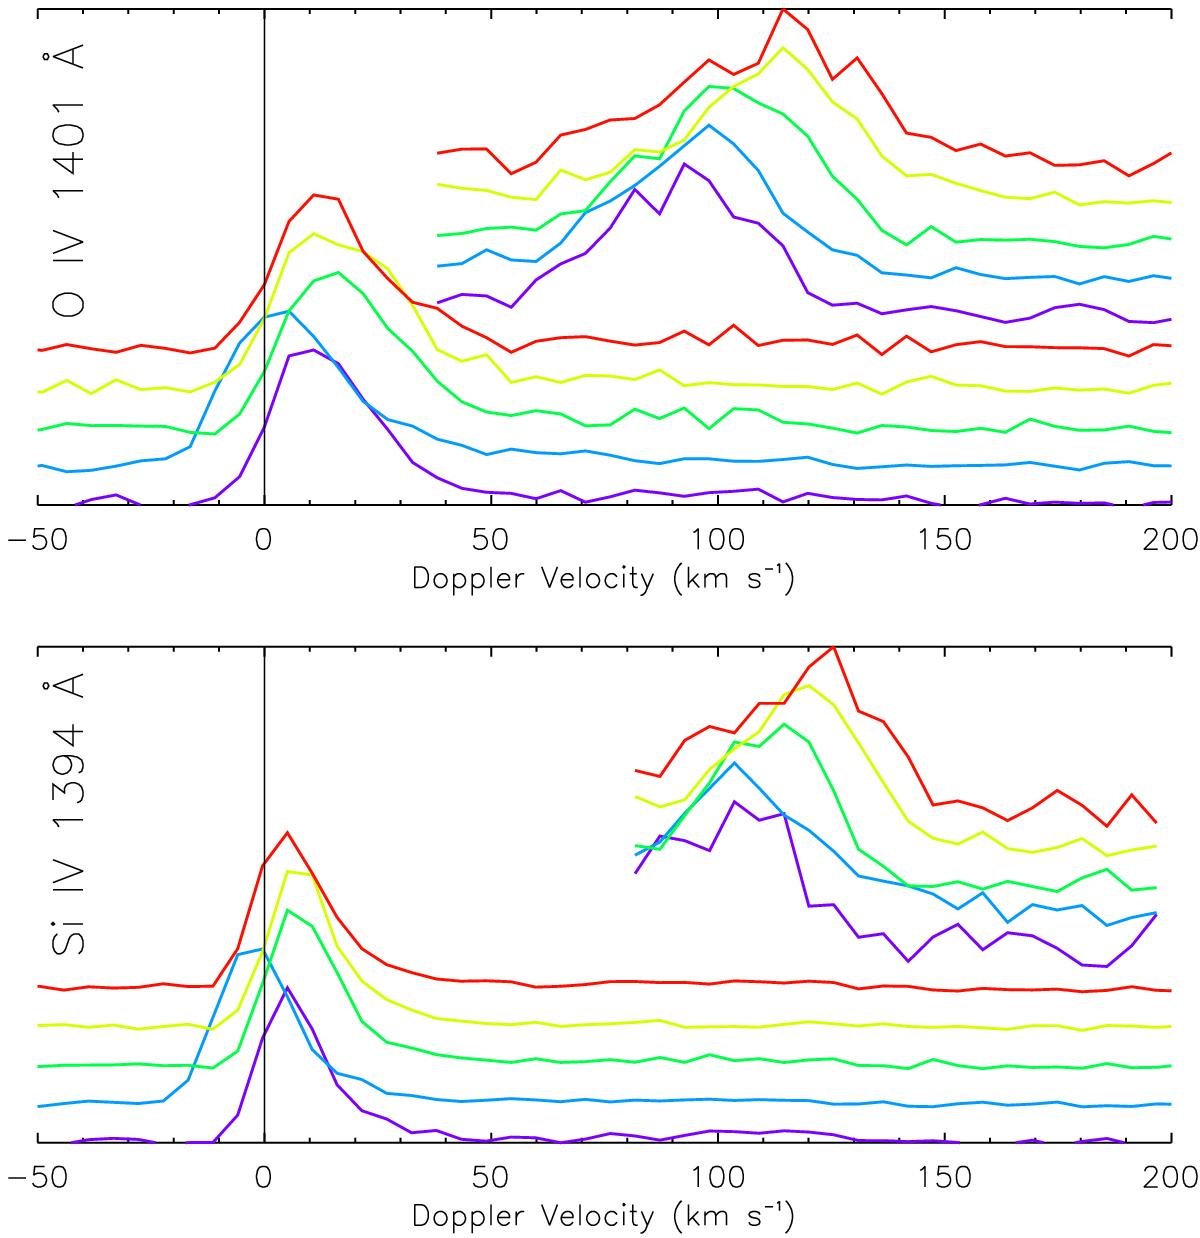
Stacked plot of the O iv and Si iv line profiles as a function of time. The footpoint spectra cover the whole wavelength range and typically peak around 10 km s -1 redshift. The loop profiles are displayed only above 40 km s -1 (O iv) and 80 km s -1 (Si iv) to avoid confusion with the footpoint spectra. They peak well above 100 km s -1. The time the profiles are taken is color-coded (increasing from purple to red with an increment of 340 s and starting at 09:37 UT). The thin vertical line indicates zero Doppler shift. See Sect. 3.1.
Current usage metrics show cumulative count of Article Views (full-text article views including HTML views, PDF and ePub downloads, according to the available data) and Abstracts Views on Vision4Press platform.
Data correspond to usage on the plateform after 2015. The current usage metrics is available 48-96 hours after online publication and is updated daily on week days.
Initial download of the metrics may take a while.