Fig. 3
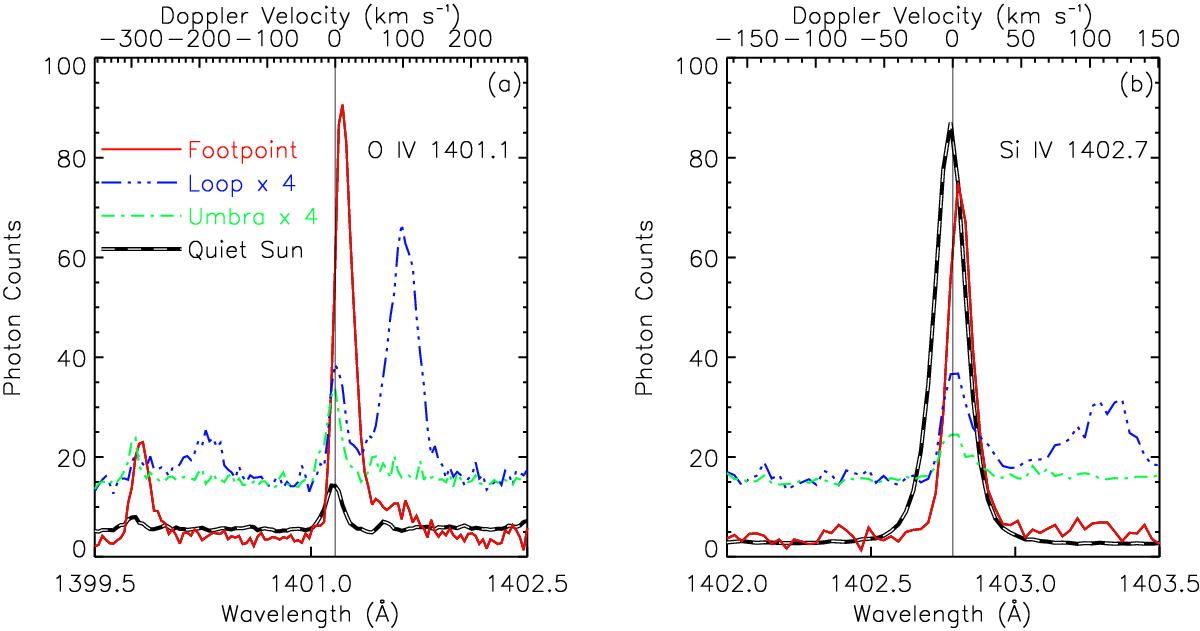
Average line profiles of O iv and Si iv in selected regions. These regions are the loop footpoint (red), the loop itself (blue) and the background umbra (green) as indicated in Fig. 2e. The black dashed line shows an average quiet Sun spectrum adjacent to the sunspot (in the right panel scaled by 0.5 for better visibility). The top axes give the wavelength in Doppler shift units with respect to the rest wavelength of O iv and Si iv, respectively. The thin vertical line in both the panels corresponds to the respective zero Doppler shift. See Sect. 3.1.
Current usage metrics show cumulative count of Article Views (full-text article views including HTML views, PDF and ePub downloads, according to the available data) and Abstracts Views on Vision4Press platform.
Data correspond to usage on the plateform after 2015. The current usage metrics is available 48-96 hours after online publication and is updated daily on week days.
Initial download of the metrics may take a while.