Fig. 2
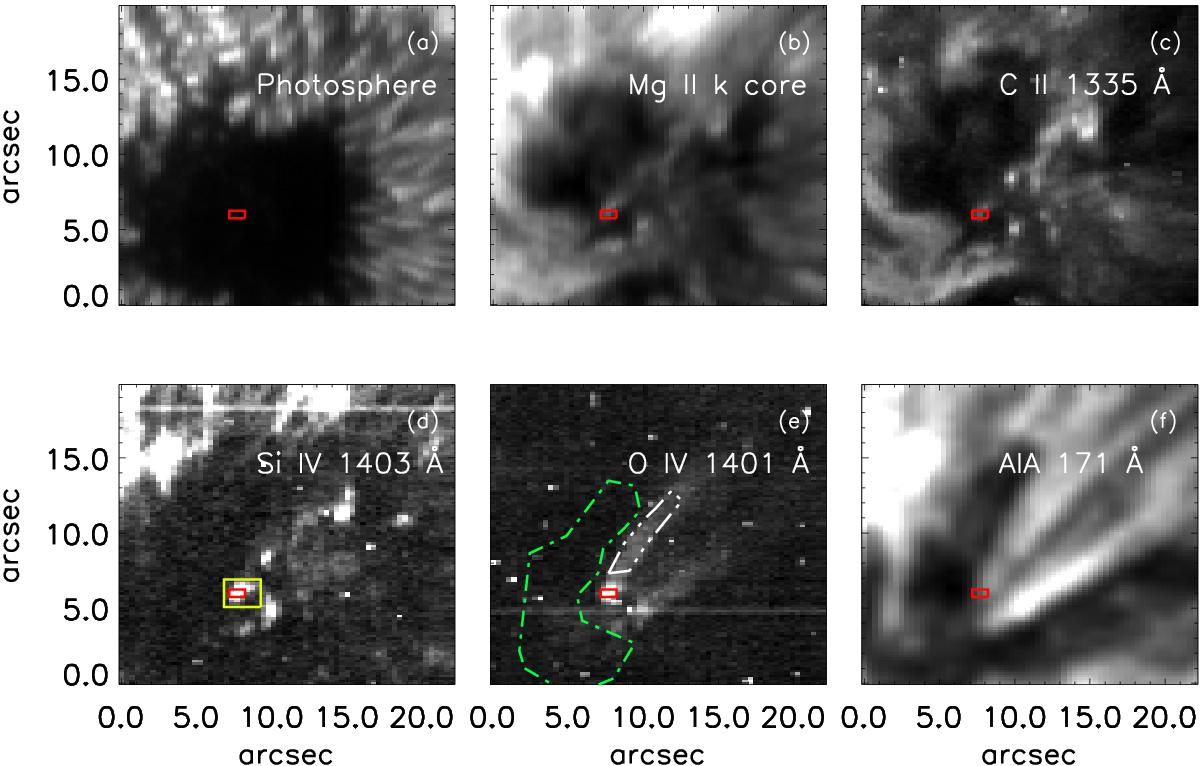
Coronal loop rooted in sunspot umbra. The panels show the region of interest at various wavelengths obtained from IRIS rasters averaged over five subsequent scans (09:37–10:05 UT). Panel a) shows the photosphere as seen in the far wing of Mg ii near 2832.83 Å. Panels b) to e) show the intensity in lines from the chromosphere to the upper transition region as recorded by IRIS and labeled with the plots. In panel e) we mark the location of a loop footpoint in red, while the white region (enclosed by the dash-triple-dotted line) and green region (enclosed by the dash-dotted line) indicate the coronal loop itself and the background umbra, respectively. Line profiles from these regions are shown in Fig. 3. For comparison, the location of the footpoint is also shown in all other panels. A snapshot of the coronal emission as recorded by AIA in the 171 Å channel is shown in panel f) at a time in the middle of the IRIS observations (09:51 UT). The field of view shown here is indicated by the red rectangle in Fig. 1c. The yellow box in panel d) is the field of view shown in Fig. 5. North is left (i.e., the AIA image here is rotated counter-clockwise by 90° with respect to Fig. 1).
Current usage metrics show cumulative count of Article Views (full-text article views including HTML views, PDF and ePub downloads, according to the available data) and Abstracts Views on Vision4Press platform.
Data correspond to usage on the plateform after 2015. The current usage metrics is available 48-96 hours after online publication and is updated daily on week days.
Initial download of the metrics may take a while.