Fig. 1
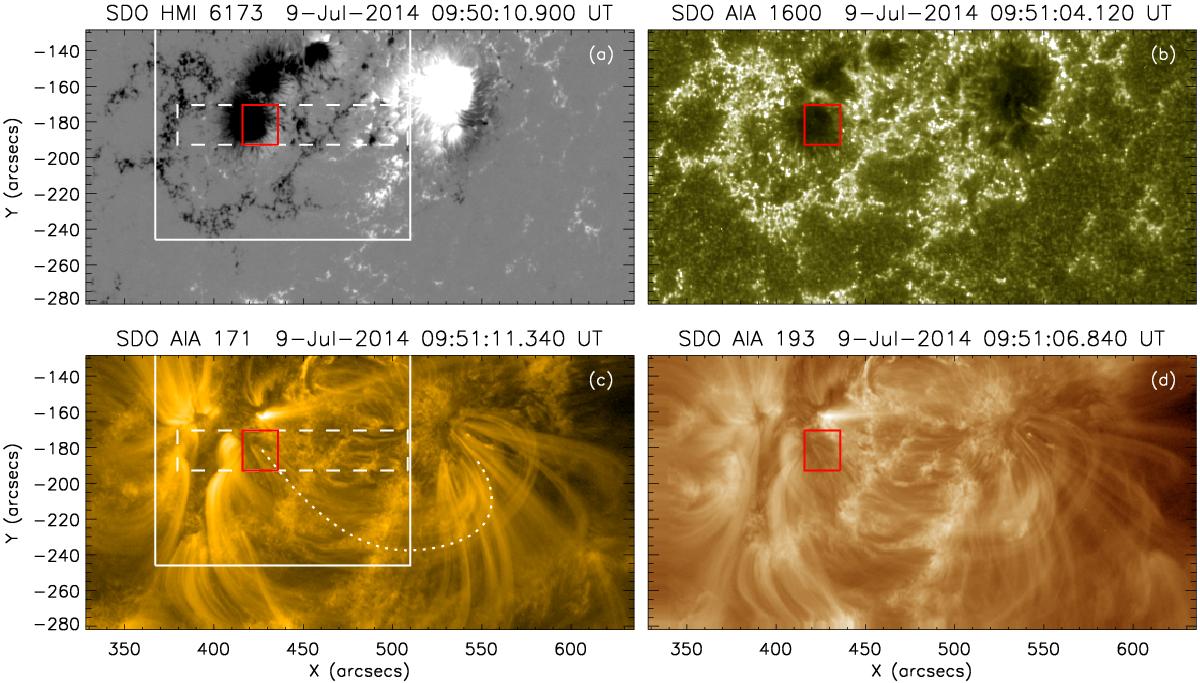
Contextual maps of AR 12108 and the region of interest taken from the SDO/HMI and AIA observations. a) SDO/HMI line-of-sight magnetogram saturated at ±750 G. b) SDO/AIA 1600 Å channel image mainly showing the chromosphere. Panels c) and d) display AIA 171 Å and 193 Å maps. The intensities in panels c) and d) are in logarithmic scale. The white solid and dashed rectangles in panels a) and c) indicate the regions of IRIS slit-jaw and raster scan observations, respectively. In all the panels we identify the regions of interest with isolated umbral coronal loops in red. One such loop is traced with a white dotted curve in panels c). A zoom into the region indicated by the red rectangle is shown in Fig. 2. North is up.
Current usage metrics show cumulative count of Article Views (full-text article views including HTML views, PDF and ePub downloads, according to the available data) and Abstracts Views on Vision4Press platform.
Data correspond to usage on the plateform after 2015. The current usage metrics is available 48-96 hours after online publication and is updated daily on week days.
Initial download of the metrics may take a while.