Fig. 4
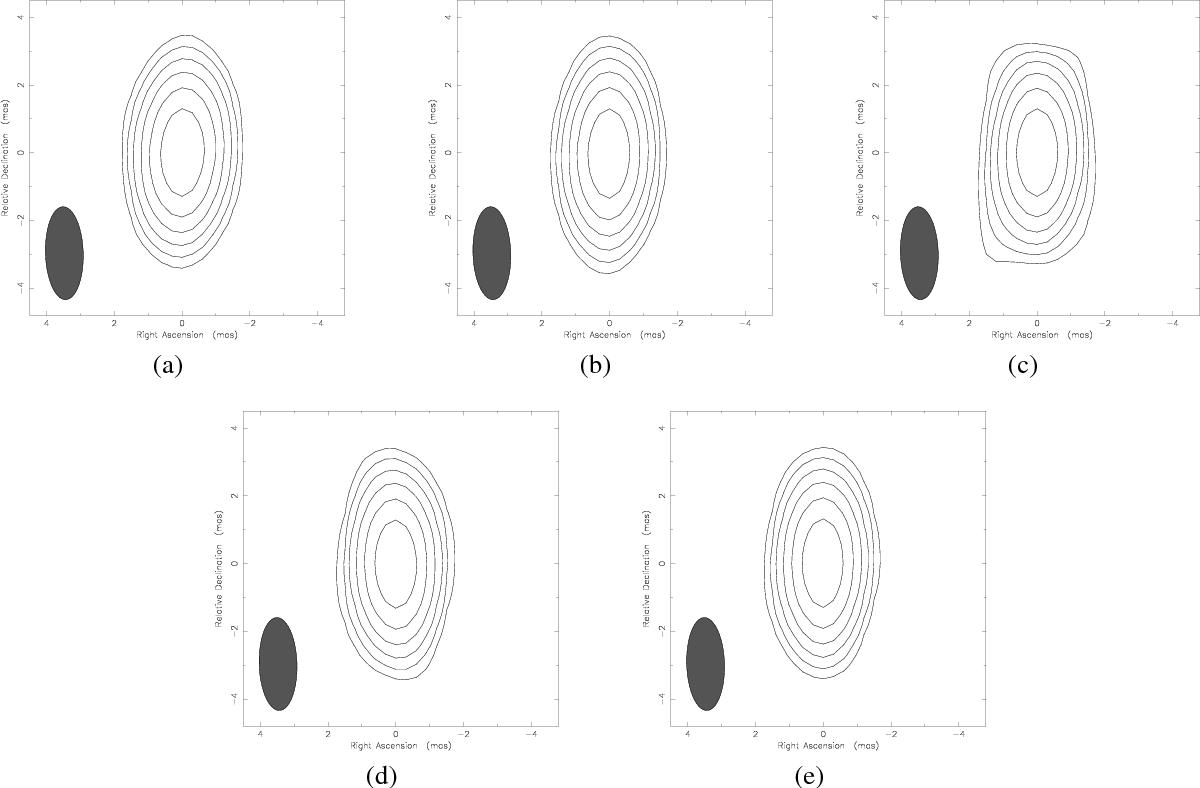
Two-hour LCP maps of Sgr A* observed on May 17 2012. a) May 17 6–8 h (6:04–08:00 UT) with a flux of 1.23 ± 0.03. b) May 17 (7:10–09:00 UT) with a flux of 1.26 ± 0.03. c) May 17 8–10 h (8:14–09:58 UT) with a flux of 1.31 ± 0.03. d) May 17 9–11 h (9:11–10:56 UT) with a flux of 1.41 ± 0.03. e) May 17 10–12 h (10:09–12:19 UT) with a flux of 1.40 ± 0.03. All maps are restored with a beam of 2.74 × 1.12 at 1.76°. The plotted contour levels are 1.73%, 3.46%, 6.93%, 13.9%, 27.7%, and 55.4%.


Current usage metrics show cumulative count of Article Views (full-text article views including HTML views, PDF and ePub downloads, according to the available data) and Abstracts Views on Vision4Press platform.
Data correspond to usage on the plateform after 2015. The current usage metrics is available 48-96 hours after online publication and is updated daily on week days.
Initial download of the metrics may take a while.