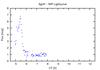
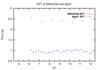
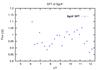
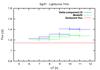
Fig. 3

NIR and 7 mm light curves on May 17 6:04–12:19 h UT 2012. a)Ks-band (2.2 μm) light curve of Sgr A* observed in polarimetry mode on 17 May 2012. The light curve shown is produced by combining pairs of orthogonal polarization channels: 0° and 90° (for further details see Shahzamanian et al. 2015). b) 7 mm DFT of NRAO 530 and Sgr A* on May 17. Sgr A* was averaged over 15 min. NRAO 530 was averaged over 2 min. c) Detrended 7 mm DFT of Sgr A* on May 17. d) 7 mm light curve derived from the two-hour maps observed on May 17 (see Fig. 4). Fluxes were obtained from delta-component maps (green) and model fitting (blue). Errors represent the formal errors of 1.7% derived from NRAO 530. Not shown are the systematic errors of ~18%, which should be corrected for by calibration.
Current usage metrics show cumulative count of Article Views (full-text article views including HTML views, PDF and ePub downloads, according to the available data) and Abstracts Views on Vision4Press platform.
Data correspond to usage on the plateform after 2015. The current usage metrics is available 48-96 hours after online publication and is updated daily on week days.
Initial download of the metrics may take a while.