Fig. 5
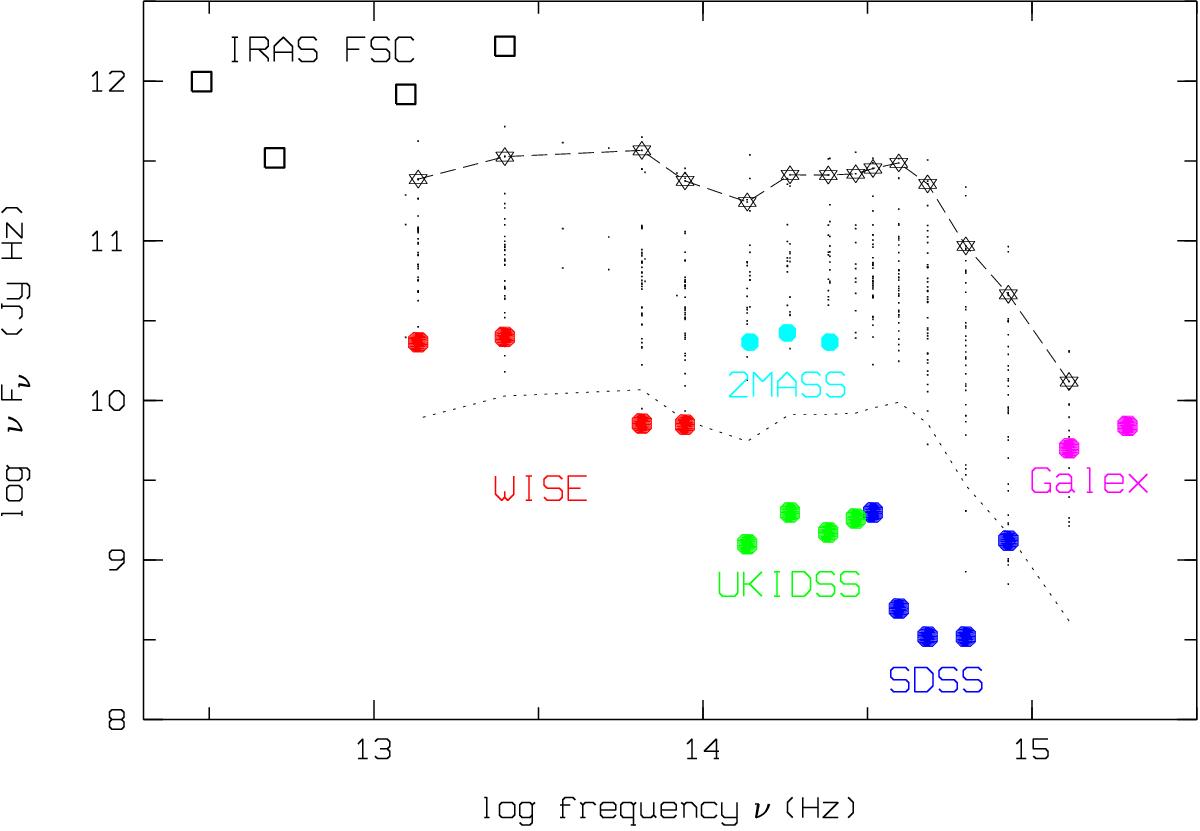
Observed fluxes for the quasars from Table C.1 (small black dots) and sensitivity limits of the major surveys used for the present study (filled symbols) and for the IRAS Faint Source Catalogue (open squares). Star symbols and dashed curve: J220445.27+003141.8; dotted curve: J220445.27+003141.8 shifted by 1.5 dex downwards.
Current usage metrics show cumulative count of Article Views (full-text article views including HTML views, PDF and ePub downloads, according to the available data) and Abstracts Views on Vision4Press platform.
Data correspond to usage on the plateform after 2015. The current usage metrics is available 48-96 hours after online publication and is updated daily on week days.
Initial download of the metrics may take a while.