Free Access
Fig. 2
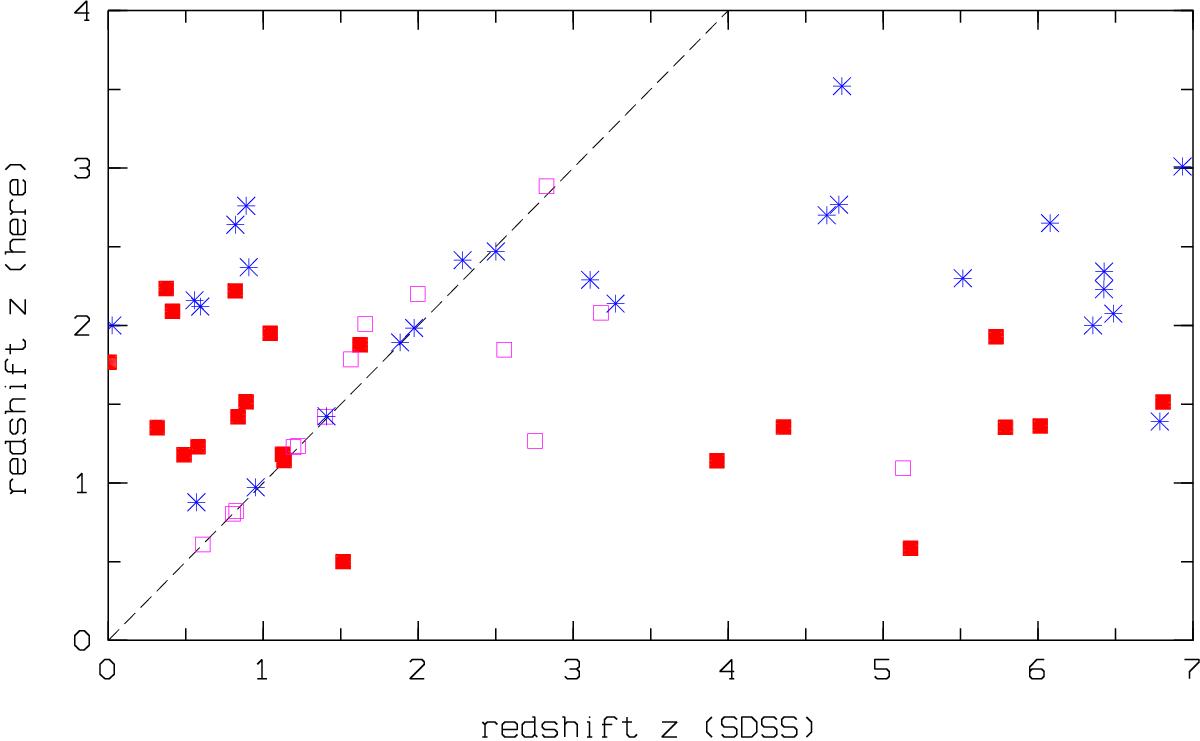
Redshifts estimated in the present study compared with the redshifts from the SDSS DR12 spectroscopic pipeline for the present samples (A: filled red squares; B: open magenta squares; C: blue asterisks).
Current usage metrics show cumulative count of Article Views (full-text article views including HTML views, PDF and ePub downloads, according to the available data) and Abstracts Views on Vision4Press platform.
Data correspond to usage on the plateform after 2015. The current usage metrics is available 48-96 hours after online publication and is updated daily on week days.
Initial download of the metrics may take a while.