Free Access
Fig. 6
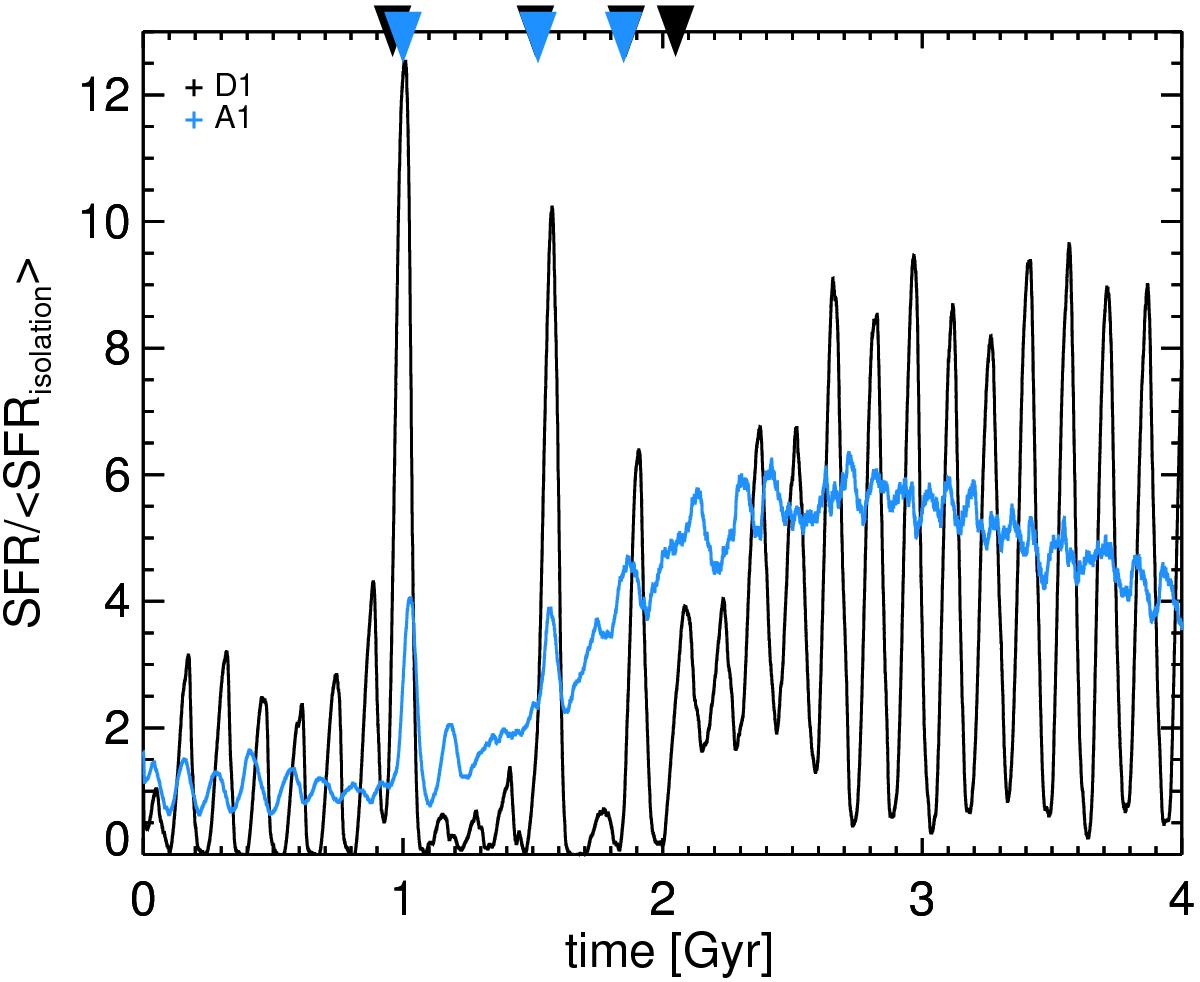
Star formation rates with respect to the average of the SFR in isolation for the first Gyr, for the systems A1 (see Fig. 4) and D1 (see Fig. 5) experiencing a 20% mass ratio merger.A number of pericentric passages of the satellite during the different simulations are indicated by the arrows at the top of the figure.
Current usage metrics show cumulative count of Article Views (full-text article views including HTML views, PDF and ePub downloads, according to the available data) and Abstracts Views on Vision4Press platform.
Data correspond to usage on the plateform after 2015. The current usage metrics is available 48-96 hours after online publication and is updated daily on week days.
Initial download of the metrics may take a while.