Fig. 3
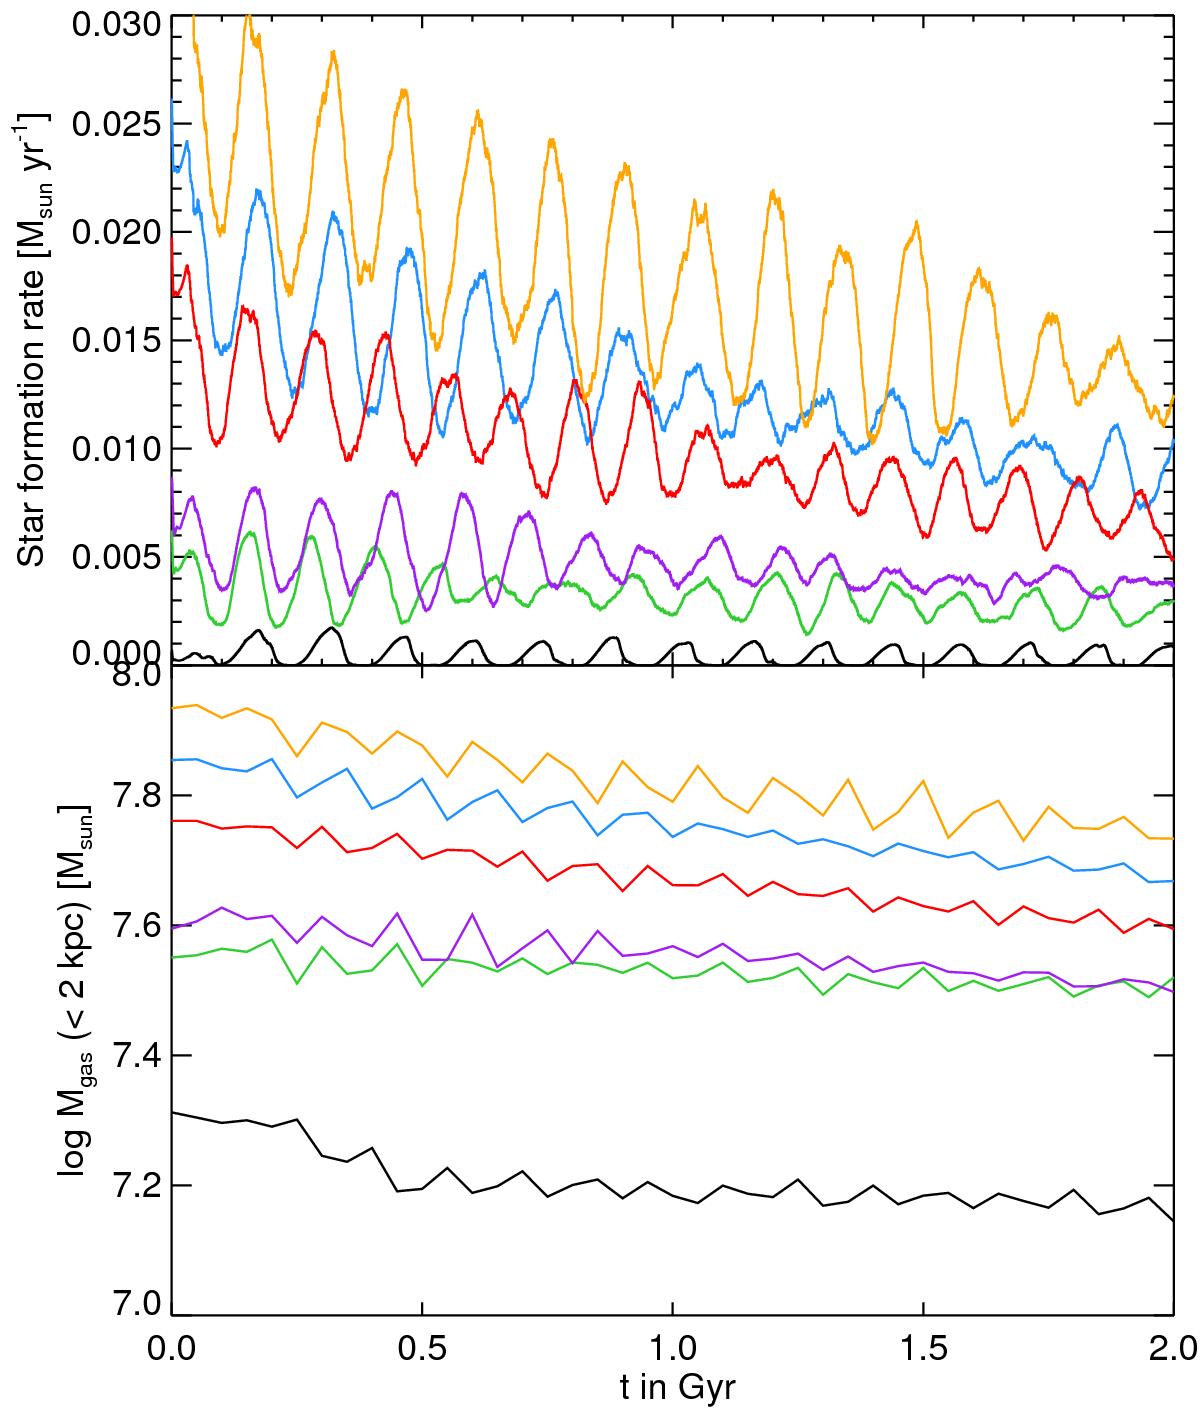
Star formation rates (top panel) and central gas masses (bottom panel) for all systems in isolation with Rg = Rd for models A (orange), B (red), C1 (blue), D1 (black), and with Rg = 2Rd for models A (purple) and C1 (green). Note that although model C1 (blue) is less massive than B (red), the star formation rate is higher for C1 because it has a higher gas mass in the center due to its higher initial gas fraction.
Current usage metrics show cumulative count of Article Views (full-text article views including HTML views, PDF and ePub downloads, according to the available data) and Abstracts Views on Vision4Press platform.
Data correspond to usage on the plateform after 2015. The current usage metrics is available 48-96 hours after online publication and is updated daily on week days.
Initial download of the metrics may take a while.