Fig. 17
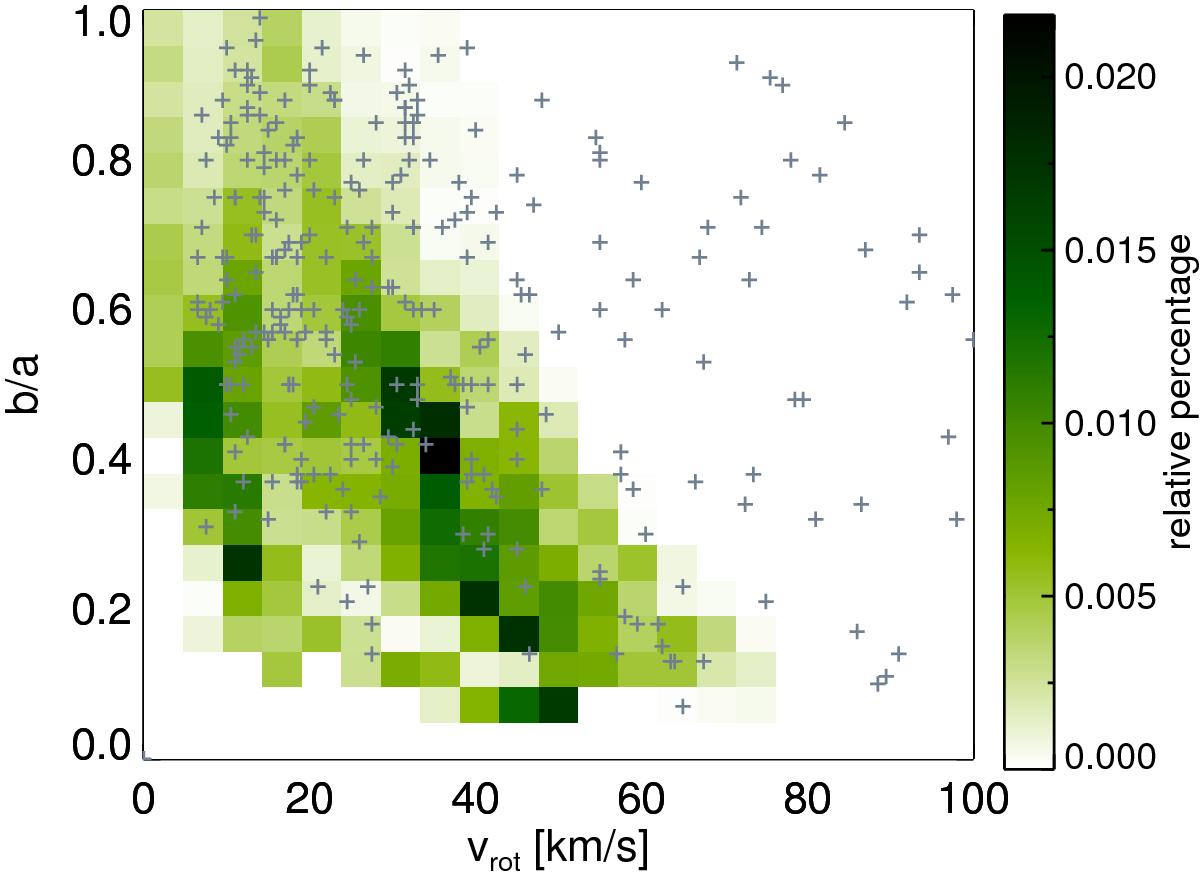
Distribution of “projected” axis ratios and rotational velocity for 100 random inclinations at intervals separated by 1 Gyr during each of the simulation runs, compared to galaxies with vrot = 0.5 × w50 ≤ 100 km s-1 from the catalog of nearby galaxies (Karachentsev et al. 2004) (gray). Darker colors indicare a higher density of objects in this plane.
Current usage metrics show cumulative count of Article Views (full-text article views including HTML views, PDF and ePub downloads, according to the available data) and Abstracts Views on Vision4Press platform.
Data correspond to usage on the plateform after 2015. The current usage metrics is available 48-96 hours after online publication and is updated daily on week days.
Initial download of the metrics may take a while.