Fig. 11
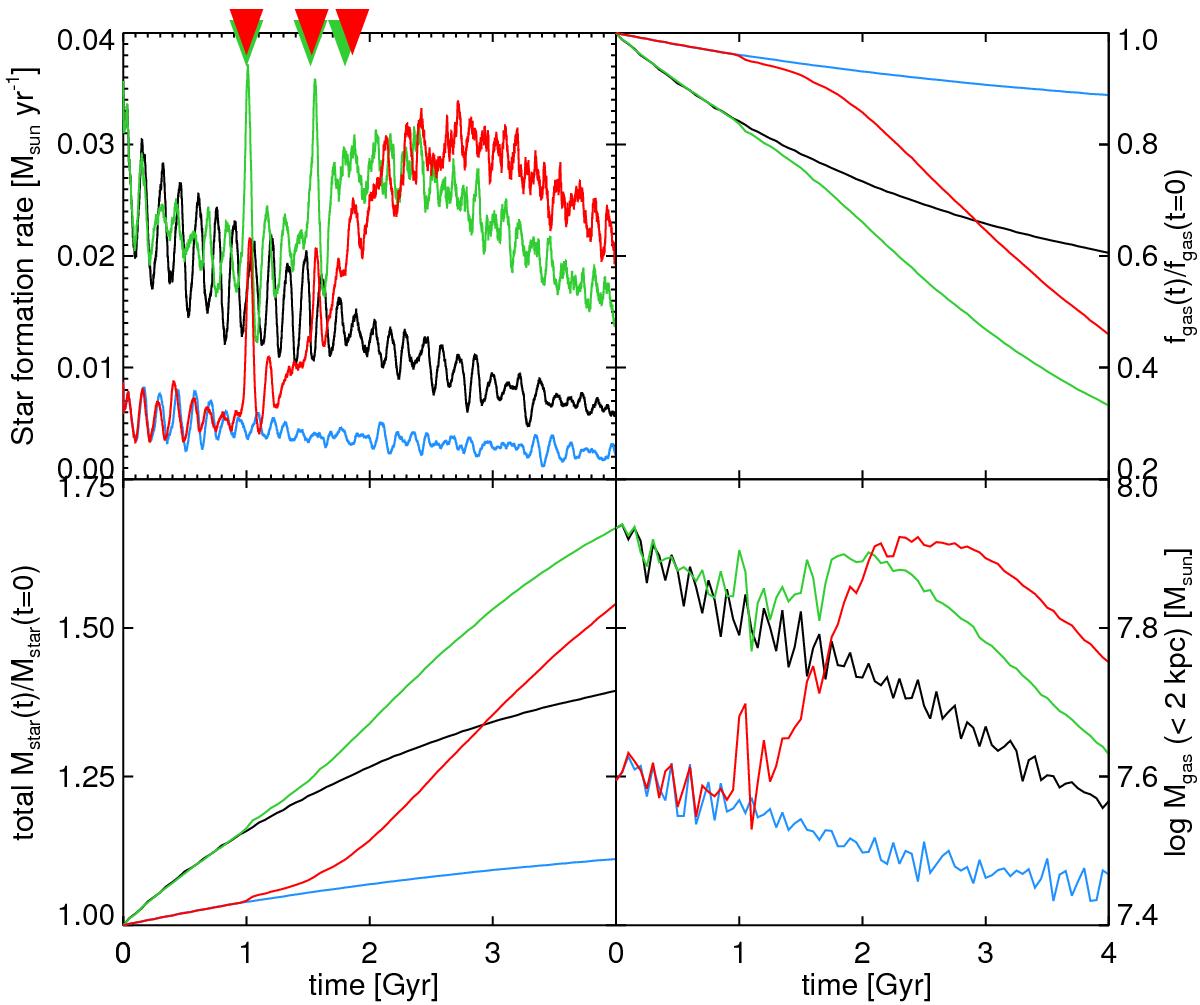
Star formation rates, relative gas fractions, relative stellar masses, and gas masses in the central parts for model A with Rg = Rd and Rg = 2Rd in isolation (black and blue, respectively) and during the merger (green and red, respectively). The arrows at the top of the top-left figure indicate a few pericentric passages of the satellite during the simulations shown.
Current usage metrics show cumulative count of Article Views (full-text article views including HTML views, PDF and ePub downloads, according to the available data) and Abstracts Views on Vision4Press platform.
Data correspond to usage on the plateform after 2015. The current usage metrics is available 48-96 hours after online publication and is updated daily on week days.
Initial download of the metrics may take a while.