Fig. 3
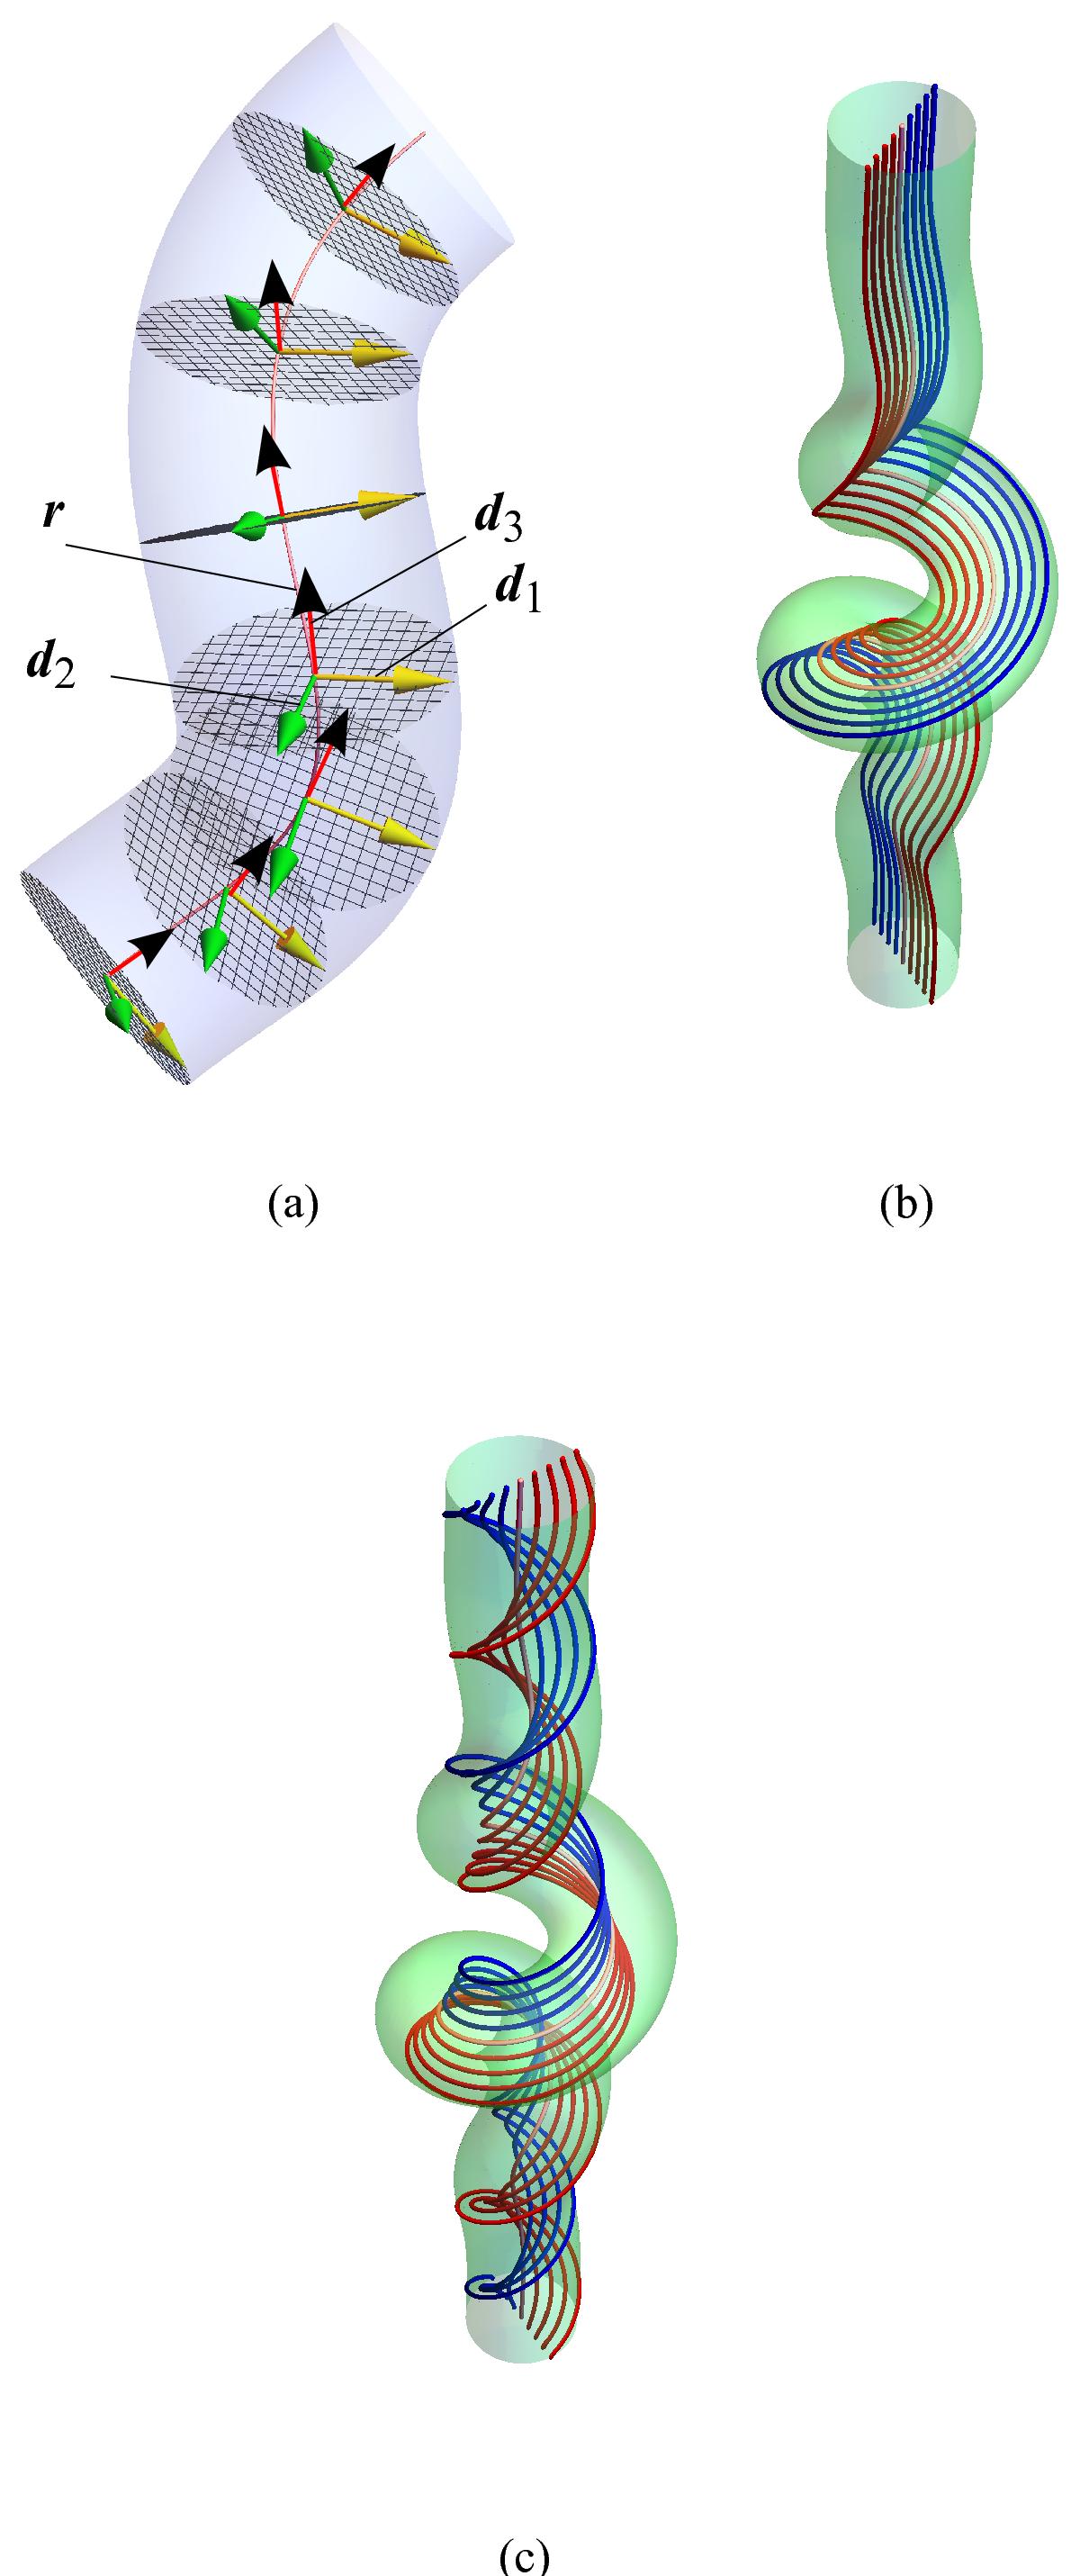
Tubular domains and curves. a) Depicts the tubular co-ordinate system T defined in Eq. (2). b) Depicts a tubular domain with u3(s) = 0, ∀s. The curves drawn in this domain are curves of constant R and θ values. We see that the curves follow the shape of the tube. b) Depicts a tubular domain with the same axis curve as a), but with u3(s) ≠ 0 so that the curves of constant (R,θ) value wind internally in the tube.
Current usage metrics show cumulative count of Article Views (full-text article views including HTML views, PDF and ePub downloads, according to the available data) and Abstracts Views on Vision4Press platform.
Data correspond to usage on the plateform after 2015. The current usage metrics is available 48-96 hours after online publication and is updated daily on week days.
Initial download of the metrics may take a while.