Free Access
Fig. 17
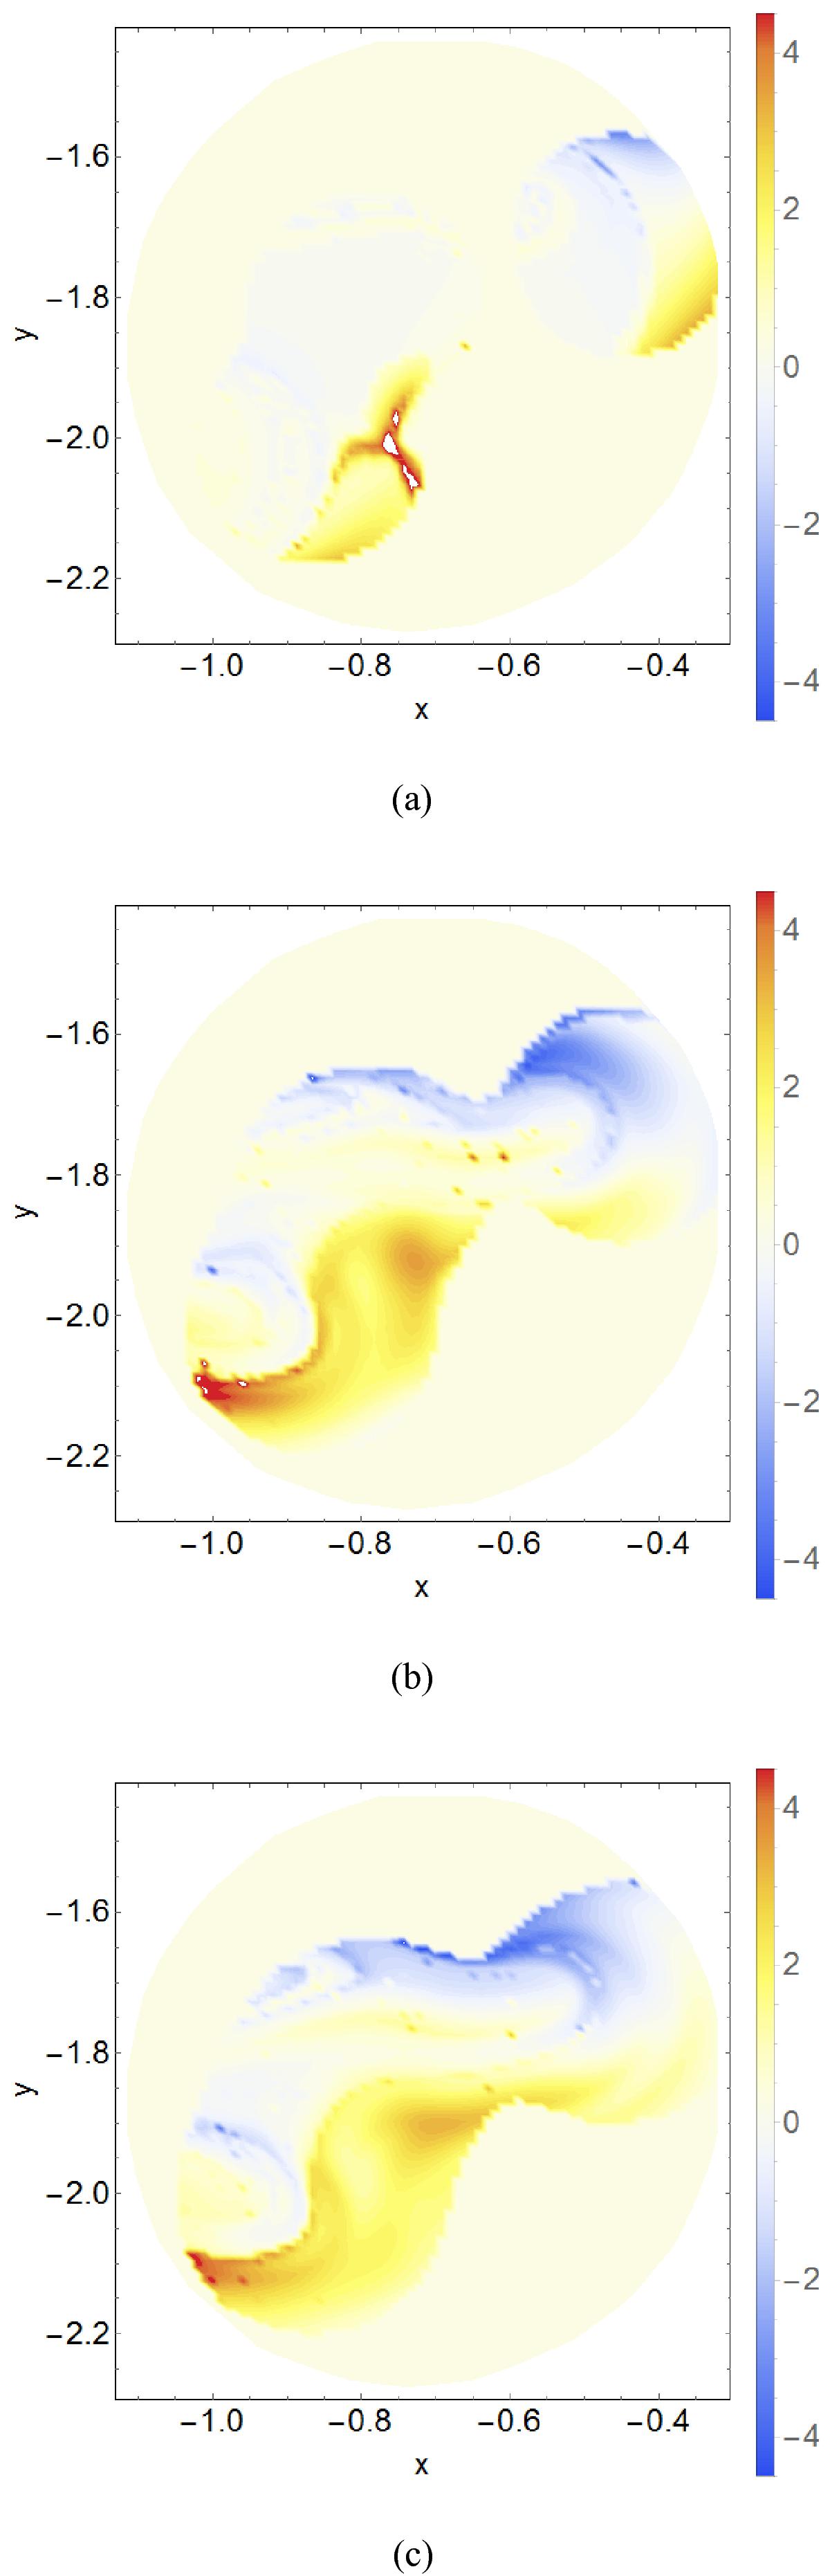
Snapshots of the local twisting distribution Lf(x,y) on a subdomain of the boundary plane which contains the initial tube footpoint, at the beginning a), middle b) and end c) of the braided field simulation. Both positive and negative values are present and the magnitude increases in b) and c).
Current usage metrics show cumulative count of Article Views (full-text article views including HTML views, PDF and ePub downloads, according to the available data) and Abstracts Views on Vision4Press platform.
Data correspond to usage on the plateform after 2015. The current usage metrics is available 48-96 hours after online publication and is updated daily on week days.
Initial download of the metrics may take a while.