Fig. A.5
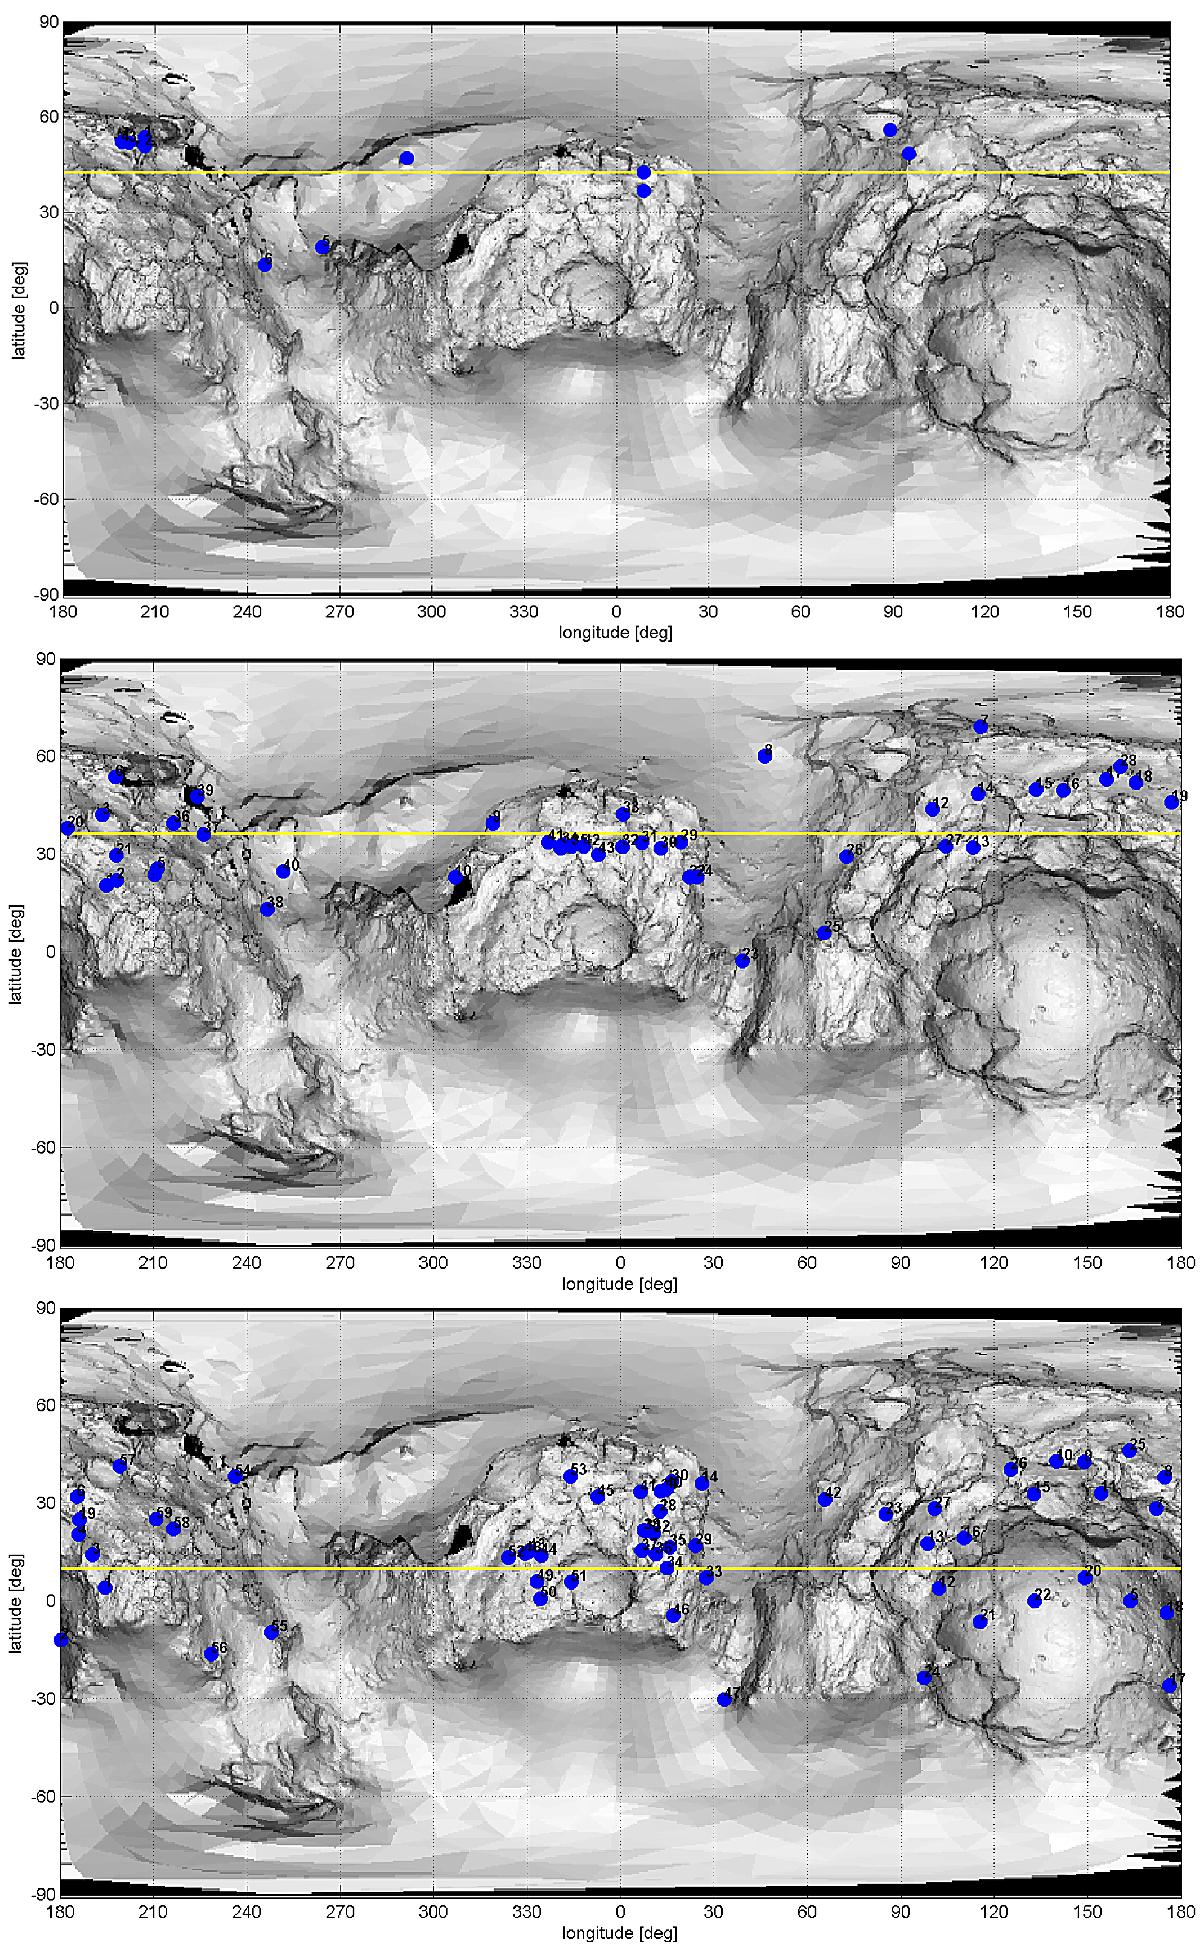
Maps of active sources obtained at three different epochs. From top to bottom: september 2014, November 2014, April 2015. The map is shaded according surface slopes, accounting for gravity and centrifugal force. White is flat, black is a vertical wall. The yellow line marks the subsolar latitude. These maps are not an exhaustive catalog of all sources, see Sect. 3
Current usage metrics show cumulative count of Article Views (full-text article views including HTML views, PDF and ePub downloads, according to the available data) and Abstracts Views on Vision4Press platform.
Data correspond to usage on the plateform after 2015. The current usage metrics is available 48-96 hours after online publication and is updated daily on week days.
Initial download of the metrics may take a while.