Fig. 5
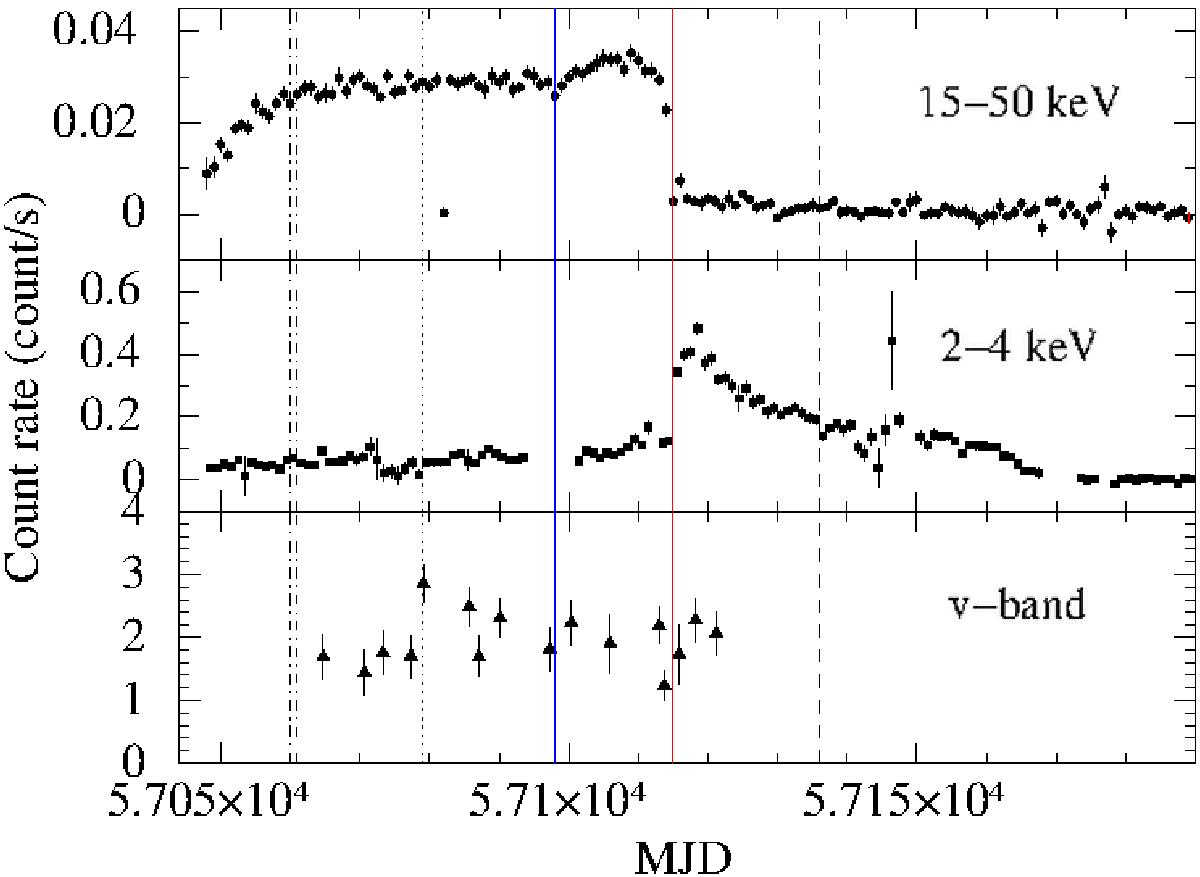
From top to bottom, the monitoring of the system J180408 with the BAT instrument mounted on Swift (15−50 keV), the MAXI camera (2−4 keV), and with UVOT (v-band) during its outburst, starting from MJD 57 048 (Jan. 26, 2015). The time of the detection of the radio jet (Deller et al. 2015) and the time of the switch to a soft X-ray spectral state are indicated with two solid lines (blue and red, respectively). Dotted and dashed lines indicate the two epochs of our REM observations (Feb. 26−Apr. 24, 2015). Two dot-dashed lines indicate the times of the NTT photometric and polarimetric observations (Feb. 7, 8, 2015).
Current usage metrics show cumulative count of Article Views (full-text article views including HTML views, PDF and ePub downloads, according to the available data) and Abstracts Views on Vision4Press platform.
Data correspond to usage on the plateform after 2015. The current usage metrics is available 48-96 hours after online publication and is updated daily on week days.
Initial download of the metrics may take a while.