Fig. 4
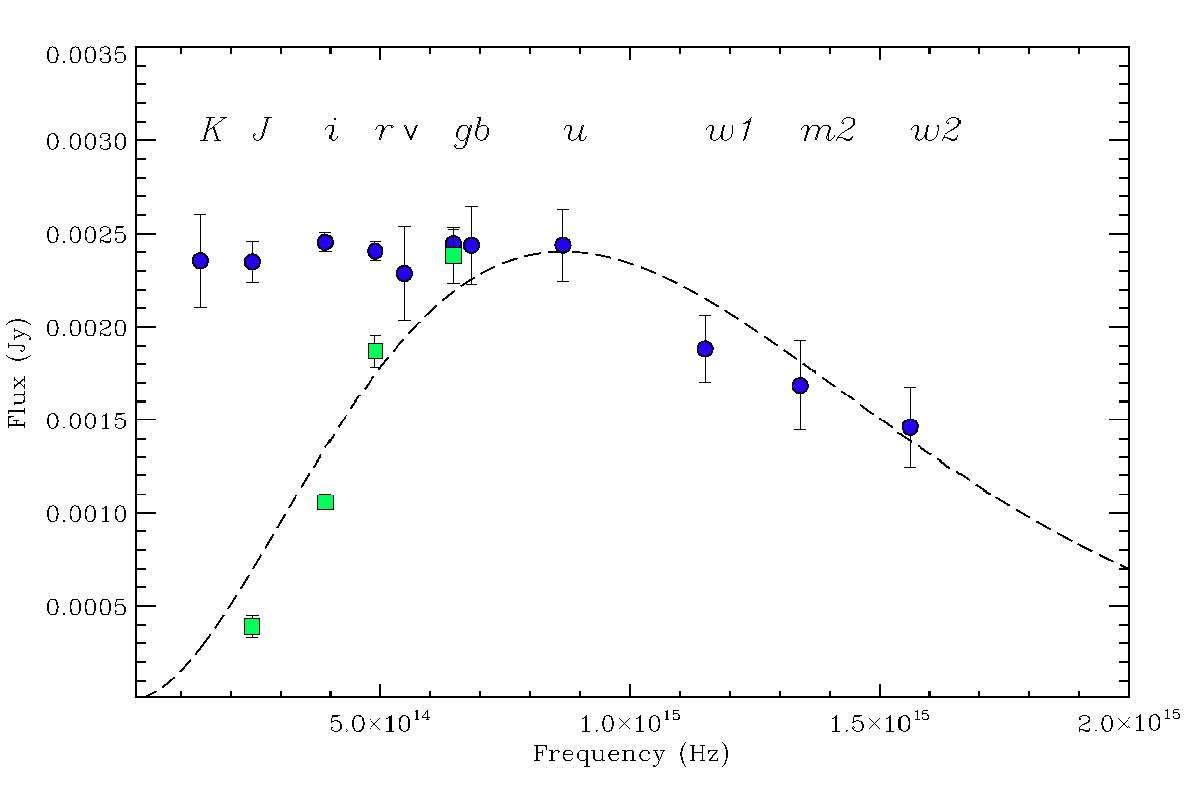
Spectral energy distributions in the NIR-optical-UV of J180408 relative to the two epochs of Feb. 26, 2015 (MJD 57 079) and Apr. 24, 2015 (MJD 57 136). Green squares depict the J-, i-, r-, g-band observations obtained with the REM telescope on Apr. 24; blue dots represent the points relative to the UVOT observations of Feb. 26 and the K-, J-, i-, r, g-band REM observations taken on Feb. 26.
Current usage metrics show cumulative count of Article Views (full-text article views including HTML views, PDF and ePub downloads, according to the available data) and Abstracts Views on Vision4Press platform.
Data correspond to usage on the plateform after 2015. The current usage metrics is available 48-96 hours after online publication and is updated daily on week days.
Initial download of the metrics may take a while.