Fig. 8
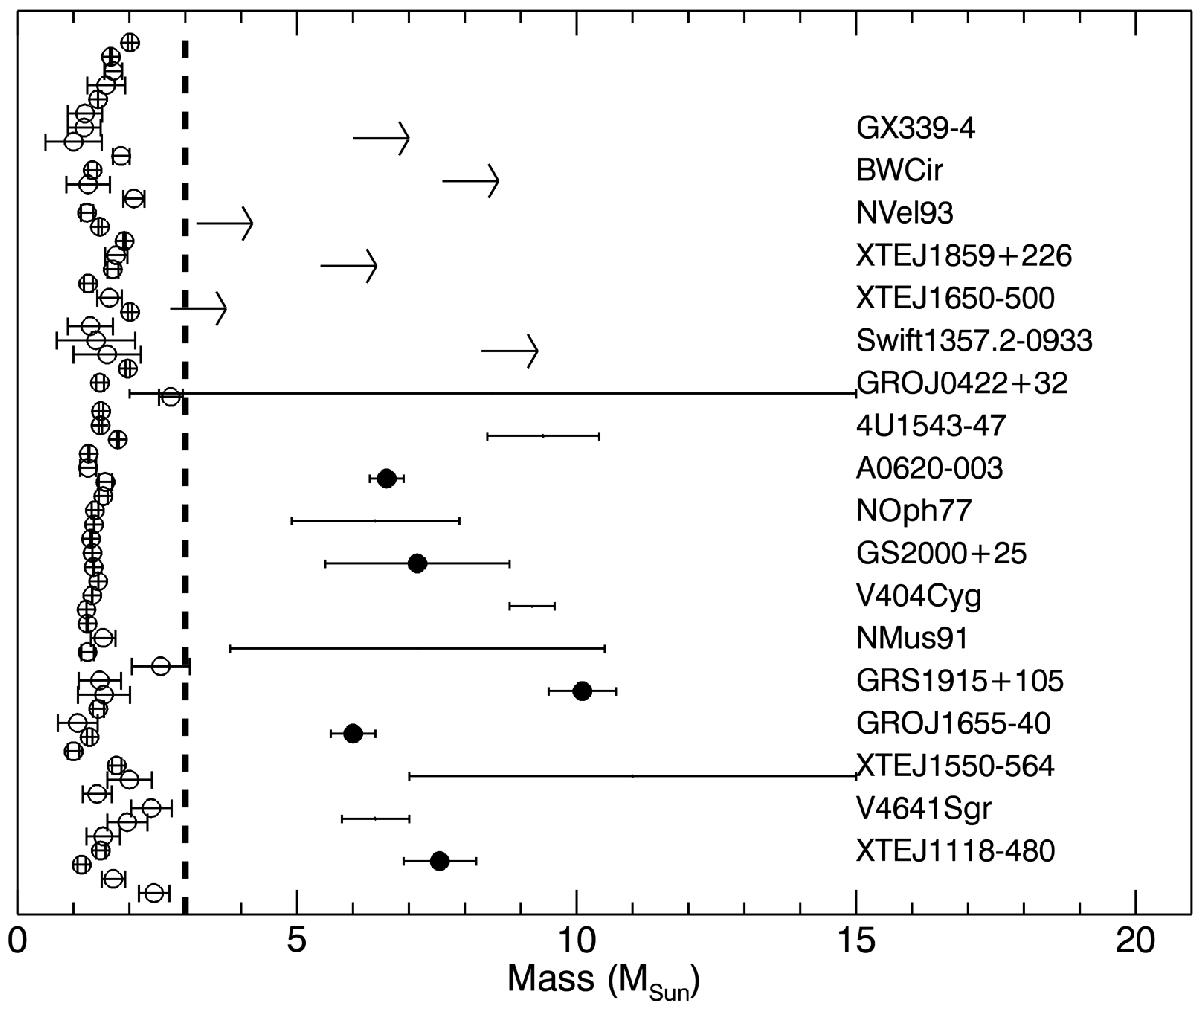
Distribution of observed compact object masses. The vertical dashed line represents the maximum mass allowed for NS (Fryer & Kalogera 2001). Open circles below that limit represent the masses of the NS compiled by Lattimer & Prakash (2005), extended with updated data from Özel et al. (2012) and Antoniadis et al. (2013). The solid circles indicate reliable BH masses (adopting the values favoured by Casares & Jonker 2014), while arrows indicate lower limits based on mass functions and upper limits to the inclination.
Current usage metrics show cumulative count of Article Views (full-text article views including HTML views, PDF and ePub downloads, according to the available data) and Abstracts Views on Vision4Press platform.
Data correspond to usage on the plateform after 2015. The current usage metrics is available 48-96 hours after online publication and is updated daily on week days.
Initial download of the metrics may take a while.