Fig. 2
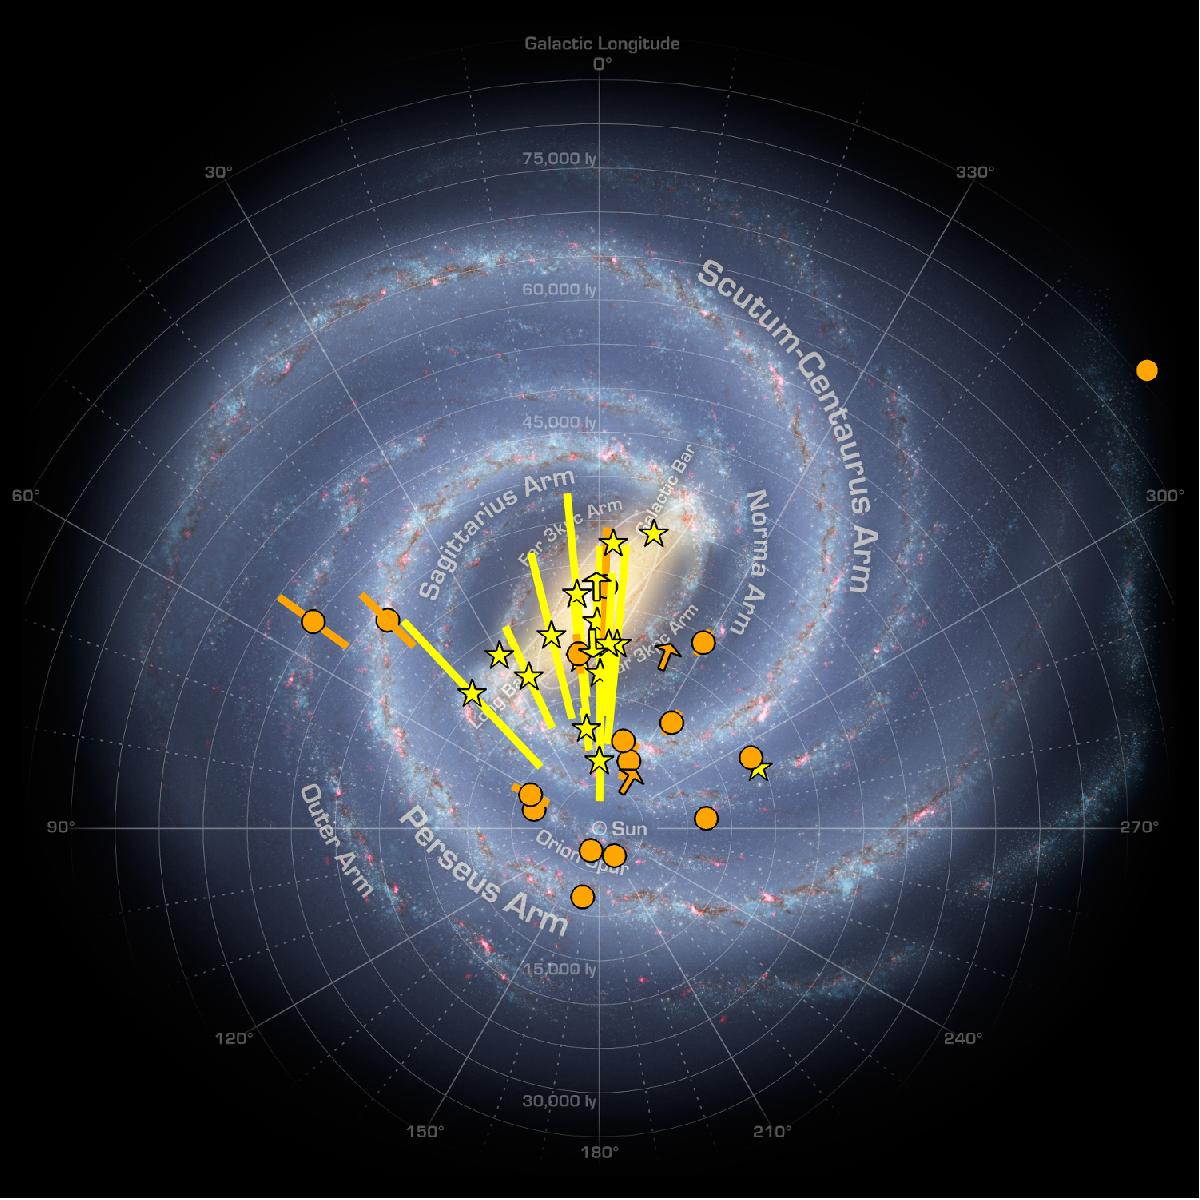
Galactic distribution of 35 BHTs with distance estimates (Table A.1), as seen from the Galactic pole. Dynamically confirmed black holes are marked in orange circles, whereas BH candidates are indicated by yellow stars. Distance ranges are represented with bars while the systems with lower limits are indicated by arrows that follow the same colour index. Some systems are overlapped with other. Each faint white ring in the background image represents an additional ~1.5 kpc from the Sun. Objects seem to concentrate along the direction towards the Galactic centre. The dynamical BHT in the upper right of the figure is BW Cir. Background image credit: NASA/JPL-Caltech/R. Hurt (SSC/Caltech).
Current usage metrics show cumulative count of Article Views (full-text article views including HTML views, PDF and ePub downloads, according to the available data) and Abstracts Views on Vision4Press platform.
Data correspond to usage on the plateform after 2015. The current usage metrics is available 48-96 hours after online publication and is updated daily on week days.
Initial download of the metrics may take a while.