Fig. 6
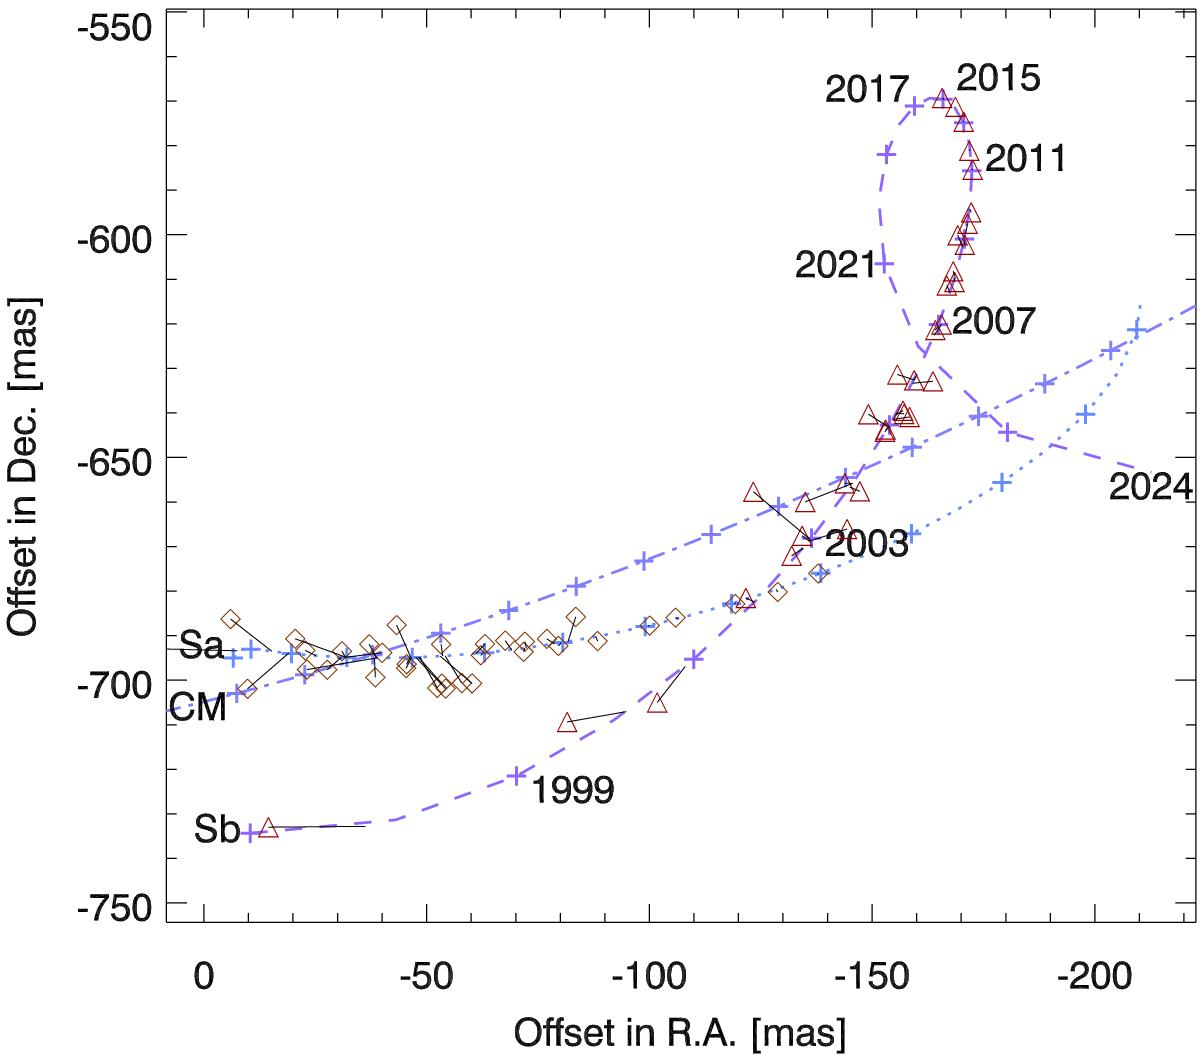
Motion of T Tau Sa and Sb in the reference frame of T Tau N. The path of Sa predicted by our orbit models is shown by the dotted line, the path of Sb by the dashed line, and the path of their center of mass by the dash-dotted line. The predicted positions on January 1 in every other year between 1997 and 2024 are marked by crosses. The observed positions of Sa are depicted by diamonds, those of Sb by triangles. Solid lines connect the observed and the predicted positions.
Current usage metrics show cumulative count of Article Views (full-text article views including HTML views, PDF and ePub downloads, according to the available data) and Abstracts Views on Vision4Press platform.
Data correspond to usage on the plateform after 2015. The current usage metrics is available 48-96 hours after online publication and is updated daily on week days.
Initial download of the metrics may take a while.