Fig. 5
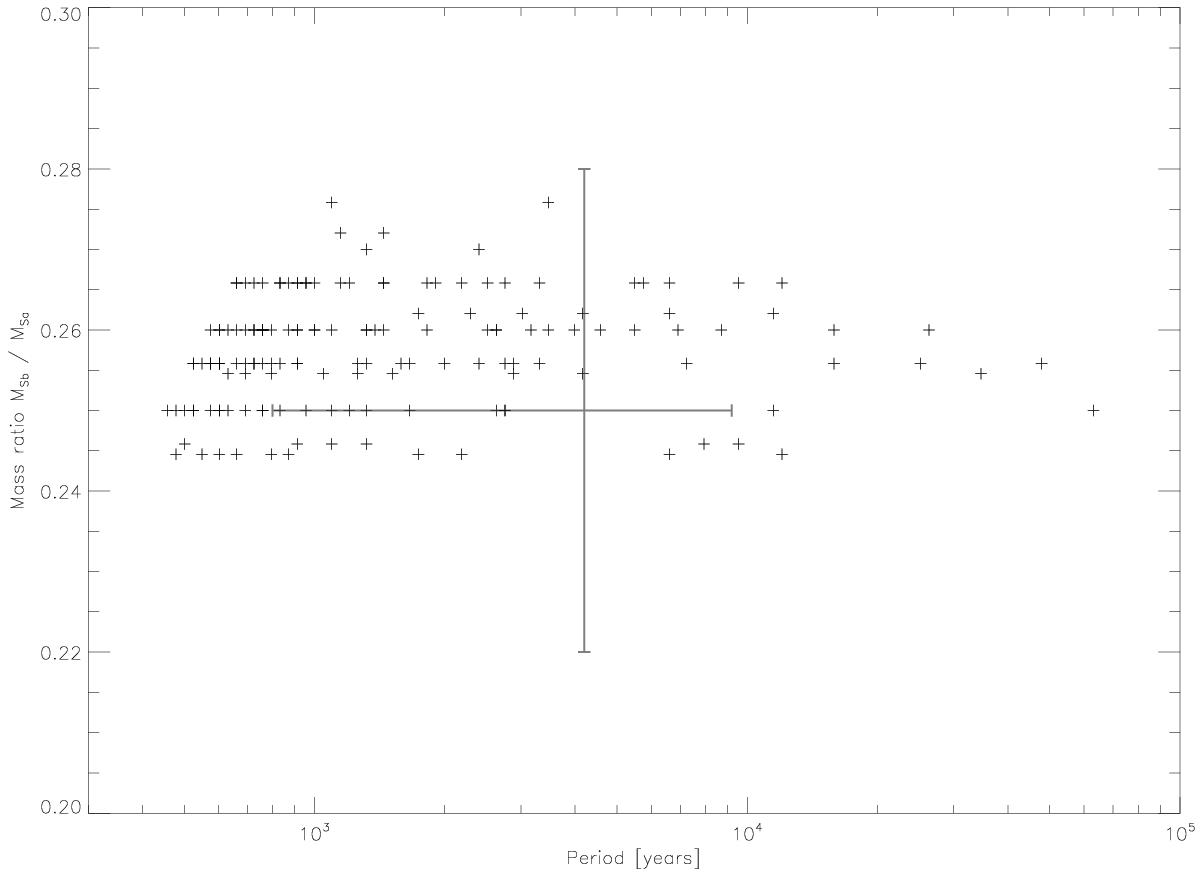
Mass ratio MSb/MSa as a function of the period of the T Tau N-S orbit model. These are the results of 150 runs of a Levenberg-Marquardt fit starting with different initial estimates for the parameters (see Sect. 3.2). The quantized appearance is caused by the grid-based fit method for the mass ratio. The large cross indicates the 68% confidence intervals for the period and mass ratio (see Tables 3 and 4). The models plotted encompass a wider range in period than the 68% confidence interval of the best solution.
Current usage metrics show cumulative count of Article Views (full-text article views including HTML views, PDF and ePub downloads, according to the available data) and Abstracts Views on Vision4Press platform.
Data correspond to usage on the plateform after 2015. The current usage metrics is available 48-96 hours after online publication and is updated daily on week days.
Initial download of the metrics may take a while.