Fig. 4
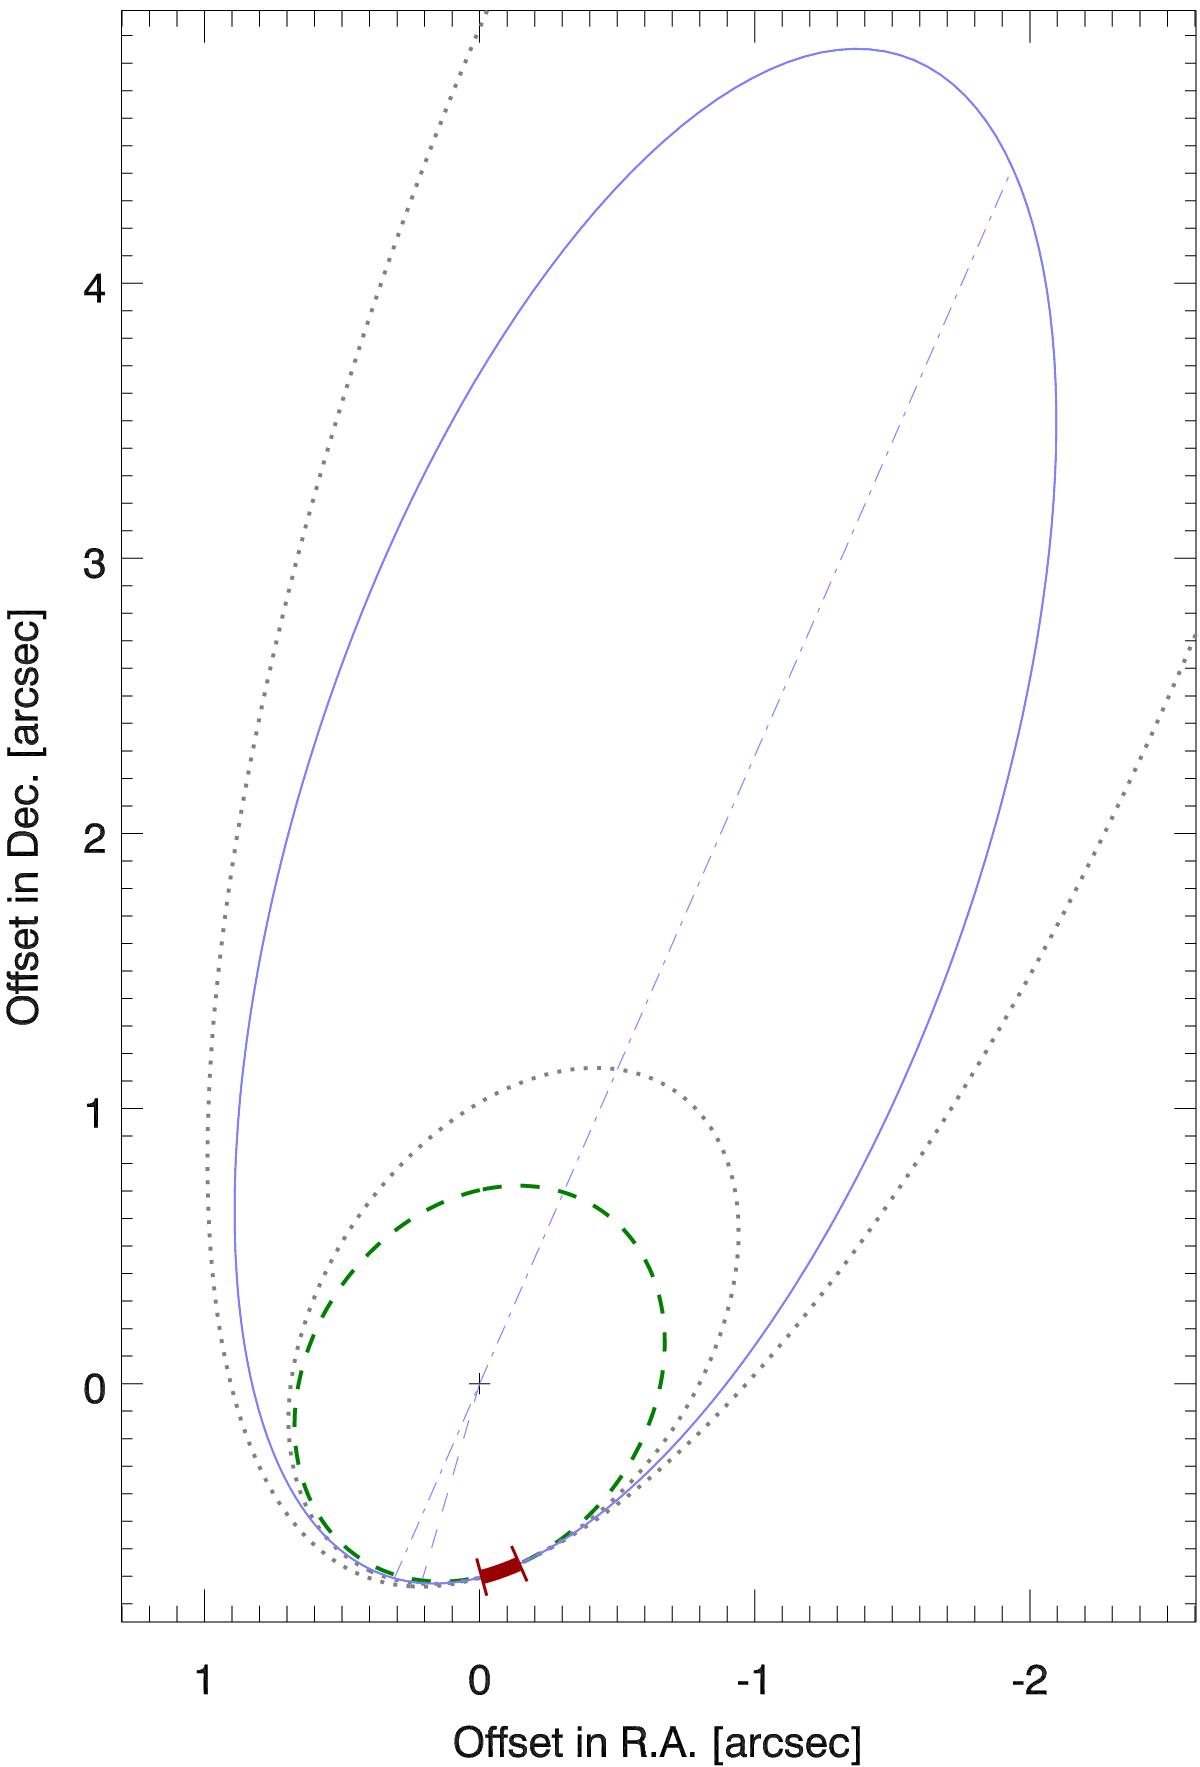
Motion of T Tau S around T Tau N. The solid line shows the orbit with the minimum χ2. The dotted lines show orbits at the short and long end of the confidence interval for the period (see Table 4), while the best circular orbit is shown by the dashed line. The thick section indicates the part of the orbit that has been observed so far.
Current usage metrics show cumulative count of Article Views (full-text article views including HTML views, PDF and ePub downloads, according to the available data) and Abstracts Views on Vision4Press platform.
Data correspond to usage on the plateform after 2015. The current usage metrics is available 48-96 hours after online publication and is updated daily on week days.
Initial download of the metrics may take a while.